PM2 is a popular daemon process manager for Nodejs with a complete feature set for a production environment, that will help you manage and keep your application online 24/7.
A process manager is a “container” for applications that facilitates deployment, enables you to manage (start, restart, stop, etc..) the application at runtime, and provides for high availability.
In this article, we will show how to monitor Nodejs applications using PM2 from the command line and on the web. This guide assumes you already have PM2 installed on your Linux system and you are already running your Nodejs application using it. Otherwise, check out:
Note: All commands in this article are run as the root user, or use sudo command if you are logged in as an administrative user with permissions to invoke sudo.
On this page
Let’s get started…
Monitoring Nodejs Application Using PM2 Terminal
PM2 provides a terminal-based dashboard that helps you monitor the resource (memory and CPU) usage of your application. You can launch the dashboard by running the following command.
# pm2 monit
Once it running, use the left/right arrows to switchboards or sections. To view logs of an app, first select it (use up/down arrows) from the process list.
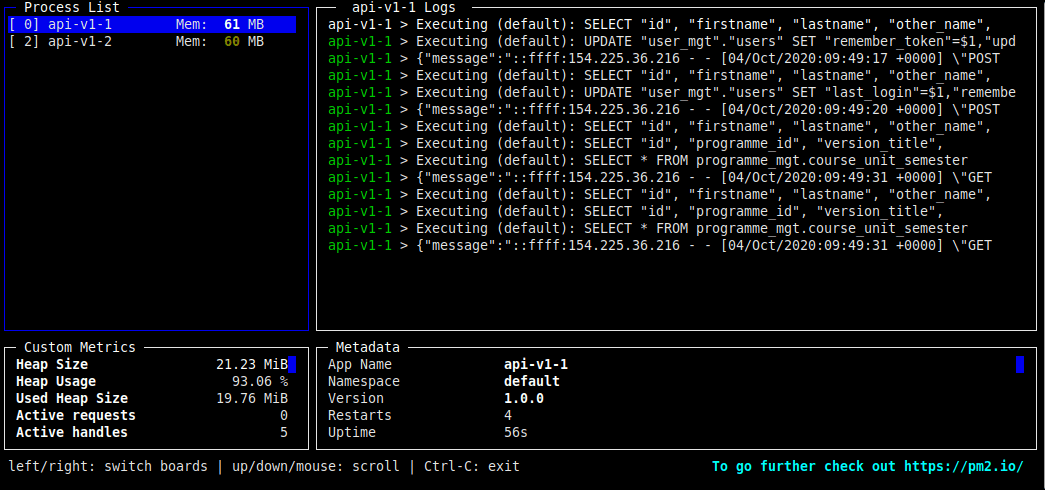
The terminal-based monitoring only works well for applications running on a single server. To monitor and diagnose cross-server applications, use the PM2 web-based dashboard.
Monitoring Nodejs Application Using PM2 Web-Based Dashboard
PM2 Plus (PM2 Web Based Dashboard) is an advanced and real-time monitoring and diagnostics tool. It provides features for both hardening your current PM2 and monitoring applications in production across servers. It features issues and exception tracking, deployment reporting, real-time logs, email and slack notification, custom metrics monitoring, and custom actions center.
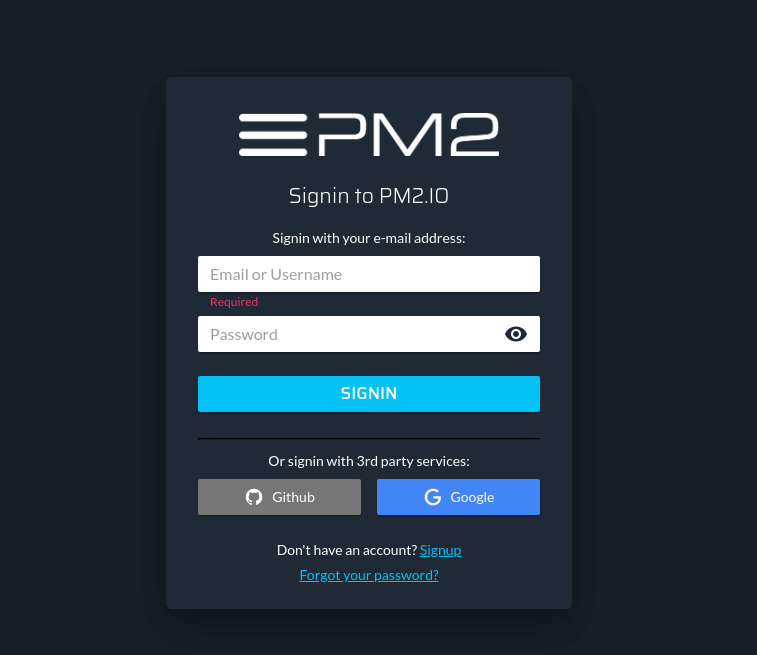
The free plan allows you to connect up to 4 servers/applications. To start testing PM2 plus, go to app.pm2.io, then sign up as shown in the following screenshot.
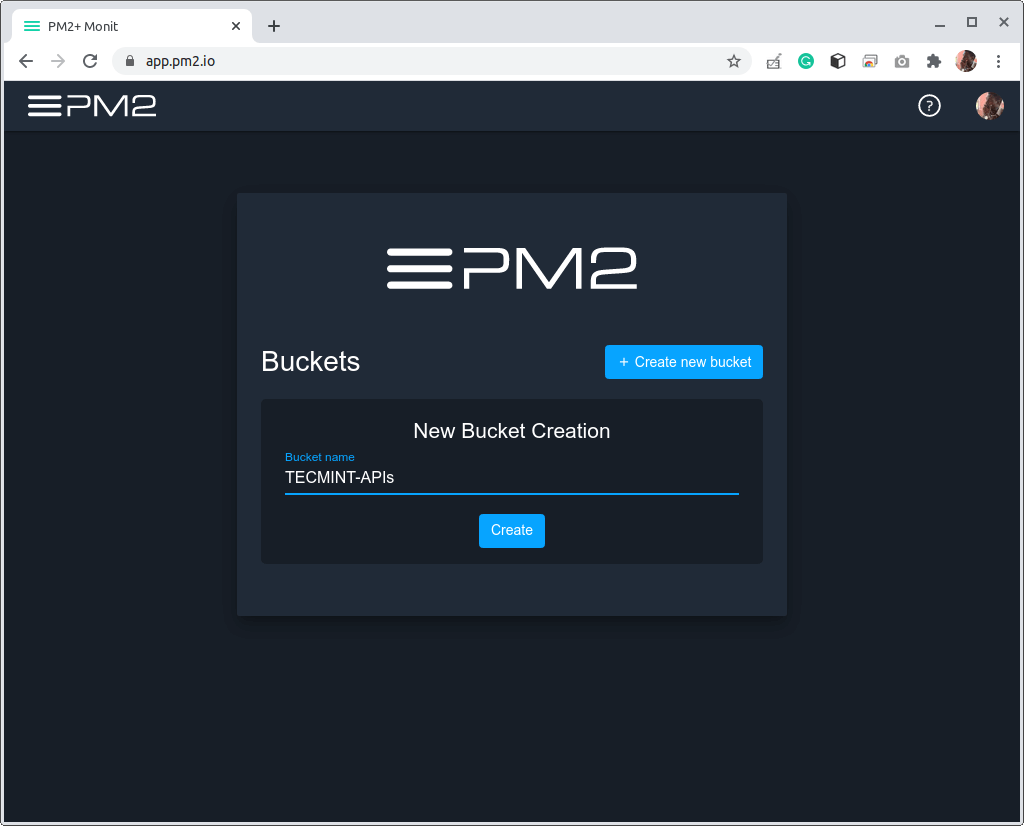
After a successful login, create a bucket to group your Nodejs servers/applications. In this example, we have called our bucket TECMINT-APIs. Then click Create.
Next, link PM2 to PM2.io and copy the command provided as highlighted in the following interface.
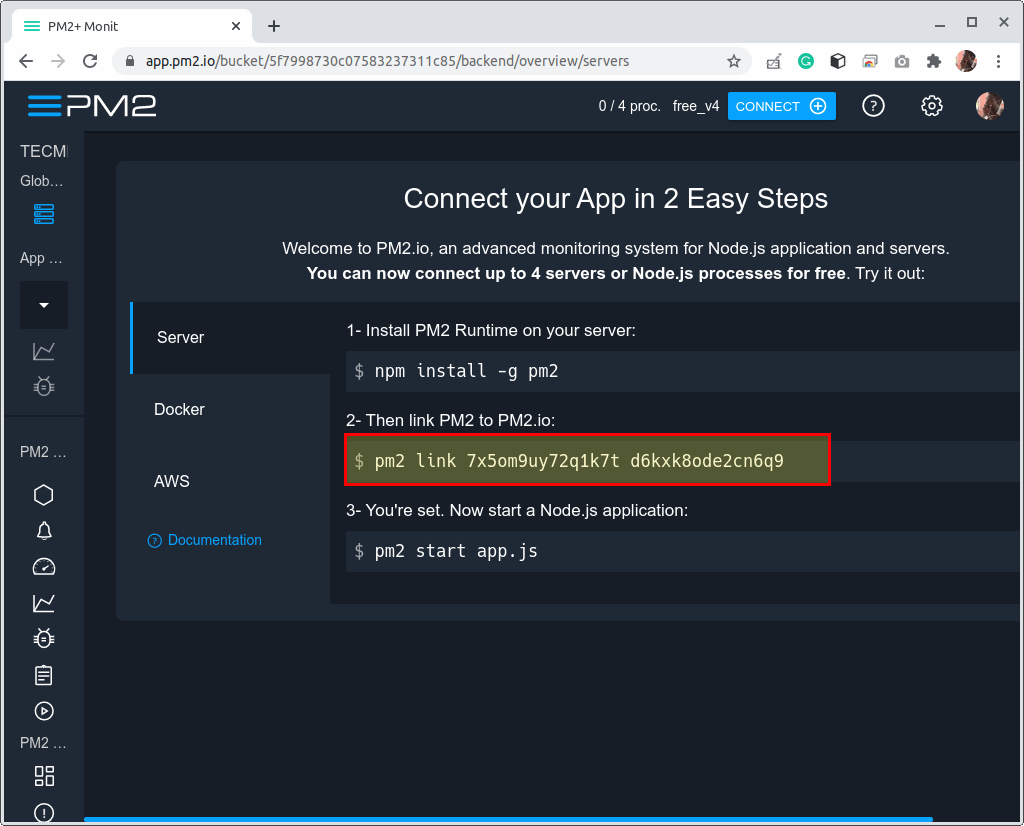
Then run the above command on the Nodejs application server.
# pm2 link 7x5om9uy72q1k7t d6kxk8ode2cn6q9

Now on the PM2.io main interface, you should have one server connected, showing a list of all your Nodejs processes in expanded mode. For each server connected, the dashboard shows you server hardware components such as the amount of RAM and CPU type. It also shows the version of Nodejs and PM2 currently installed.
For each process, you will see the percentage of CPU and the amount of memory it is consuming, and much more. If you are using version control, it also shows the branch and last merge details.
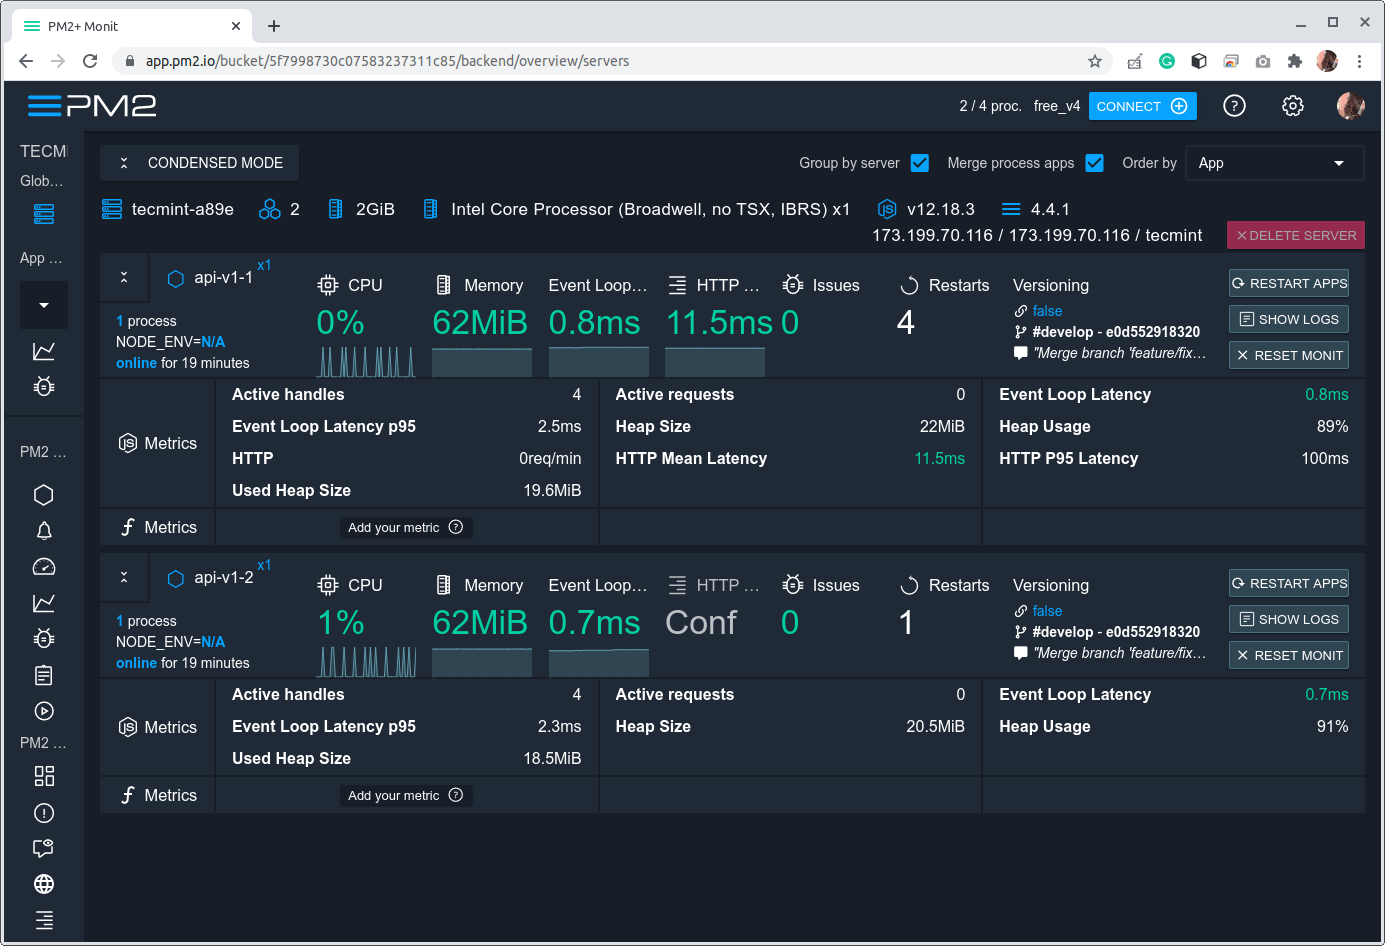
To unlink a server from the app.pm2.io monitoring dashboard, run the following command on the server to unlink:
# pm2 unlink

After running the above command, you can delete the server from the app.pm2.io dashboard.
Monitoring Your Server Resources Using pm2-server-monit
pm2-server-monit is a PM2 module to automatically monitor key aspects of your server such as CPU average usage, free and used drive space, free and used memory space, all processes running, TTY/SSH opened, the total number of open files, as well as network speed (input and output).
To install it, run the following command:
# pm2 install pm2-server-monit
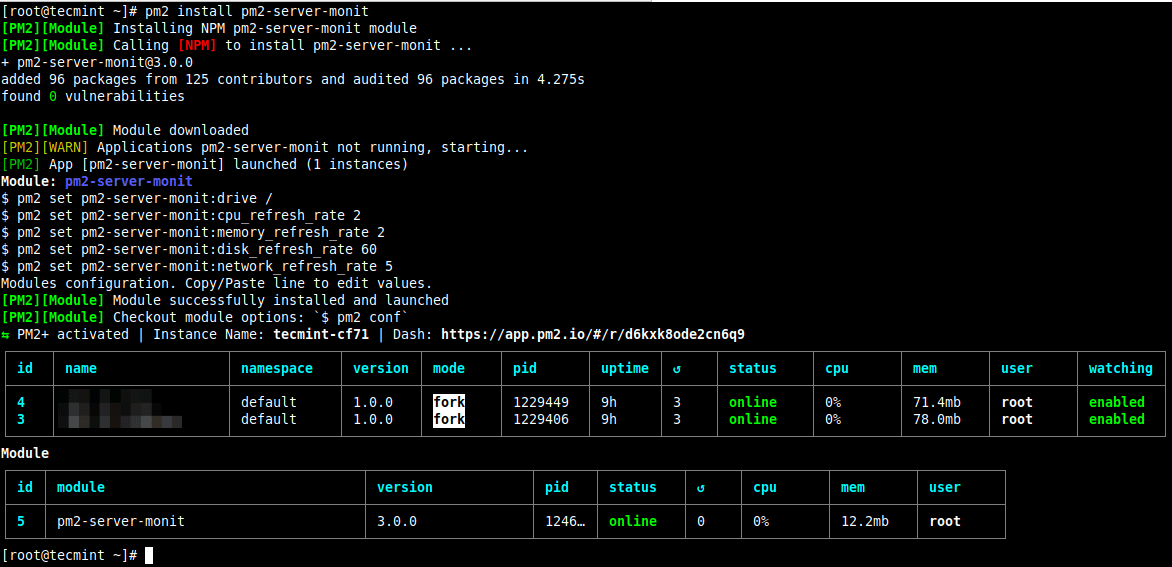
If PM2 is linked to app.pm2.io, pm2-server-monit should automatically appear in the list of monitored processes. Now you can monitor your server resources from the web dashboard as shown in the following image.
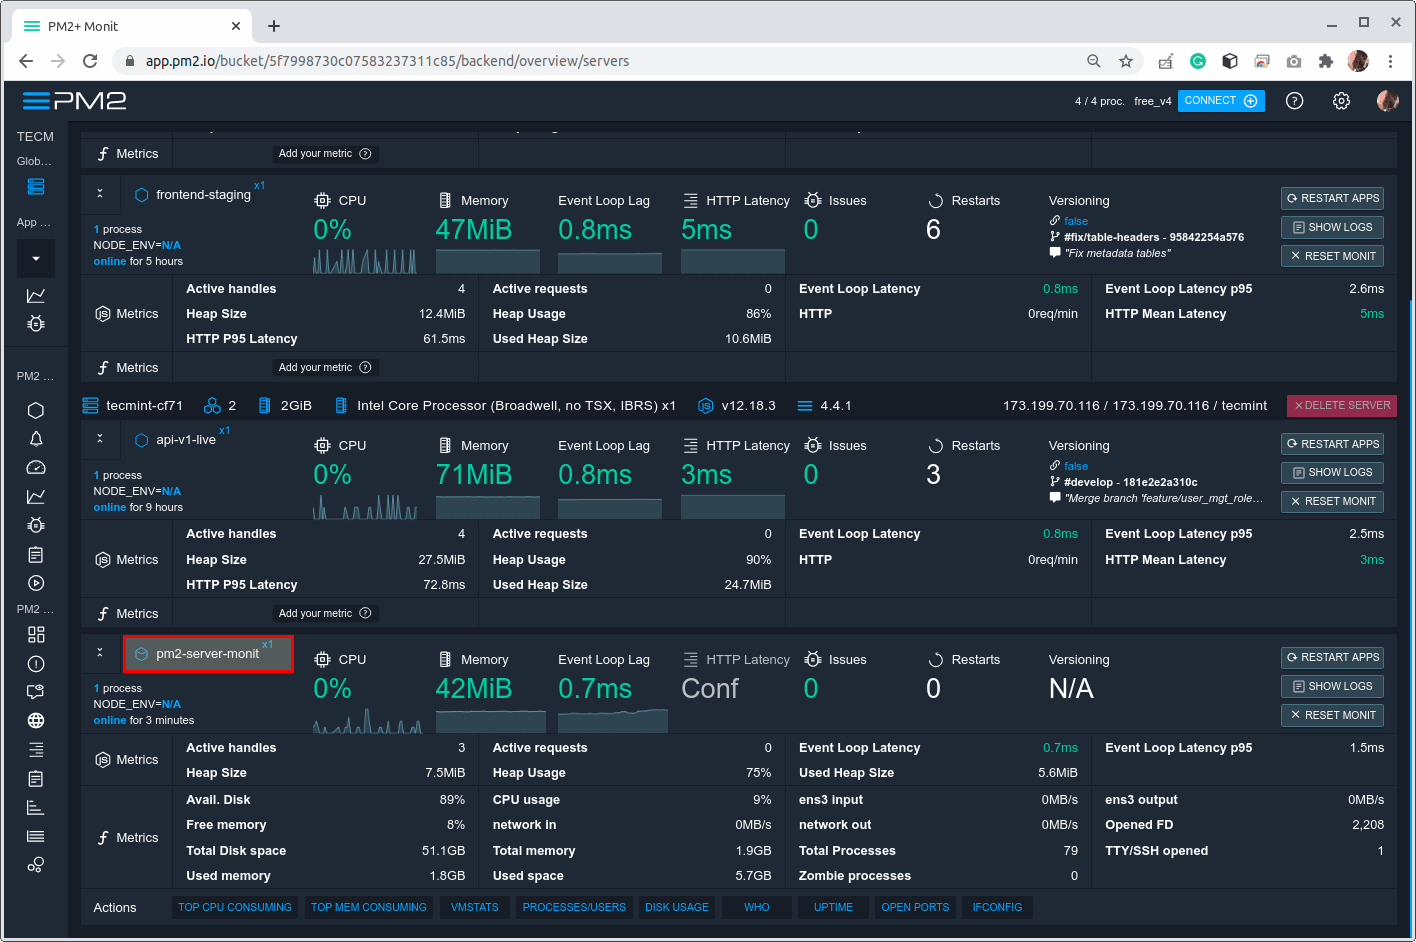
To remove pm2-server-monit from your server, run the following command:
# pm2 uninstall pm2-server-monit
That’s it for now! You can share your thoughts about Nodejs application monitoring using PM2, with us via the feedback form below.


Please, when trying to use PM2 Web Dashboard I could not find a way to display real-time “console.log” messages sent from the running process. Is this resource available for beginners? Currently, I can have it in CLI mode by command
pm2 myapp --attach.Thanks