In our earlier article, we have reviewed the usage of TOP Command and it’s parameters. In this article we have came up with another excellent program called Interface TOP (IFTOP) is a real time console-based network bandwidth monitoring tool.
It will show a quick overview of network activities on an interface. Iftop shows a real time updated list of network usage bandwidth every 2, 10 and 40 seconds on average. In this post we are going to see the installation and how to use IFTOP with examples in Linux.
Requirements:
- libpcap : library for capturing live network data.
- libncurses : a programming library that provides an API for building text-based interfaces in a terminal-independent way.
Install libpcap and libncurses
First start by installing libpcap and libncurses libraries using your Linux distribution package manager as shown.
$ sudo apt install libpcap0.8 libpcap0.8-dev libncurses5 libncurses5-dev  [On Debian/Ubuntu]
# yum  -y install libpcap libpcap-devel ncurses ncurses-devel             [On CentOS/RHEL]
# dnf  -y install libpcap libpcap-devel ncurses ncurses-devel             [On Fedora 22+]
Download and Install iftop
Iftop is available in the official software repositories of Debian/Ubuntu Linux, you can install it using apt command as shown.
$ sudo apt install iftop
On RHEL/CentOS, you need to enable the EPEL repository, and then install it as follows.
# yum install epel-release
# yum install  iftop
On Fedora distribution, iftop is also available from the default system repositories to install using the following command.
# dnf install iftop
Other Linux distributions, can download iftop source package using wget command and compile it from source as shown.
# wget http://www.ex-parrot.com/pdw/iftop/download/iftop-0.17.tar.gz
# tar -zxvf iftop-0.17.tar.gz
# cd iftop-0.17
# ./configure
# make
# make install
Basic usage of Iftop
Once installation done, go to your console and run the iftop command without any arguments to view bandwidth usage of default interface, as shown in the screen shot below.
$ sudo iftop
Sample output of iftop command which shows bandwidth of default interface as shown below.
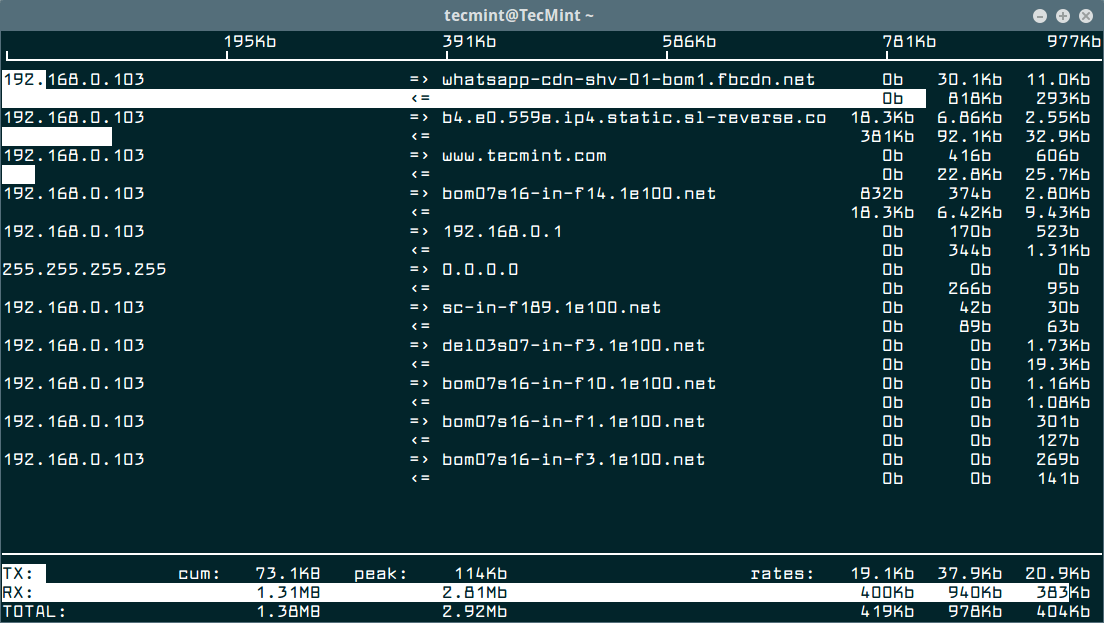
Monitor Linux Network Interface
First run the following ifconfig command or ip command to find all attached network interfaces on your Linux system.
$ sudo ifconfig
OR
$ sudo ip addr show
Then use the -i flag to specify the interface you want to monitor. For example the command below used to monitor bandwidth on the wireless interface on the test computer.
$ sudo iftop -i wlp2s0
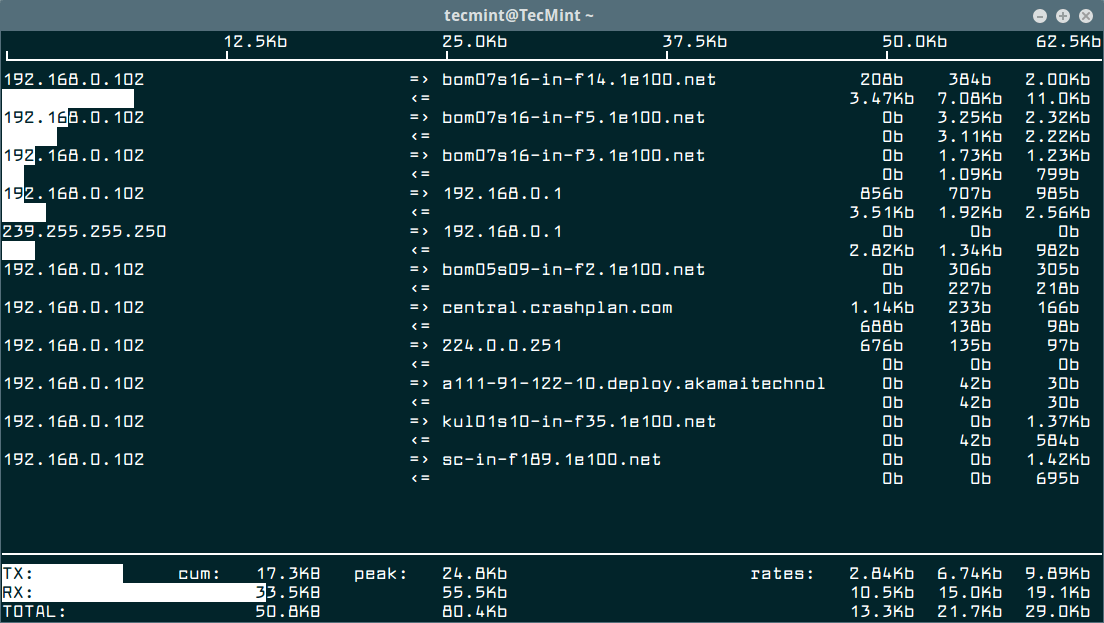
To disable hostname lookups, use the -n flag.
$ sudo iftop -n eth0
To turn on port display, use the -P switch.
$ sudo iftop -P eth0
Iftop Options and Usage
While running iftop you can use the keys like S, D to see more information like source, destination etc. Please do run man iftop if you want to explore more options and tricks. Press ‘q‘ to quit from running windows.
In this article, we’ve showed how to install and use iftop, a network interface monitoring tool in Linux. If you want to know more about iftop please visit iftop website. Kindly share it and send your comment through our comment box below.




Thanks Murray, much appreciated.
Good tip, thanks!
Dear Tecmint admins,
I configured firewalld with zone work and added sources (our internal/external IP address) , restarted services , in IFTOP I can see different (strange) IP(DNS) connections . how I can disable this traffic/connection please ? Thank you .
@Norbert,
Could you share the Iftop output or any screenshot, so that we can have better idea..
Hi Ravi , please I have a question, do you think that the traffic could be applied for a specific website ? for example, the user have 500 Kb/s for the download and 300Kb/s for the upload when he connect to zippyshare.com ( for exple) , and have the full speed when he connect to other websites ?
Dear Vicky,
The IfTop only monitors bandwidth it doesn’t provide any restriction module. If you want to restrict or specify bandwidth limit to specific user or website use Proxy.
Ravi..thanks for your answer…:)
Hi to all…. how to trace in CentOS the client user browsing which website…..?? it is possible to trace it?????
Check your Apache logs at /var/log/httpd to get better browsing information of clients.
You know something is up with your network when it takes ages to download the libpcap library.
Its shoing TX == In GB
RX == in MB
Can u tell me how to stop transfer
Thanks for this guide.
A shame I didn’t knew about this utitily all the years I work with Linux, as it’s already included in centos 6 when using the epel repository and just needed to be installed.
Friend, it’s not too late and please don’t be shame, there are many tools out there we even don’t know yet. So, use this utility effectively to monitor your network bandwidth.
I am not able to configure or use rpmforge and epel repositary to install third party packages i am using rhel6 64 bit ..kindly help me also unable to configure/get gpg-key for repos.
Could you post the what exact error you getting. so we could trace out and give solutions.
I know its too late to answer this but i hope it could help other people try to install this package
rpm -Uvh http://download.fedoraproject.org/pub/epel/6/x86_64/epel-release-6-8.noarch.rpm
rpm -Uvh http://rpms.famillecollet.com/enterprise/remi-release-6.rpm
yum –enablerepo=remi,remi-test install iftop
just type that in your console specially when using centos 6.2 using epel repo
Thanks Mark.:)
Nice help /.//// it work fine my centos 5.8 32bit