The Cockpit is a web console with a friendly user interface that allows you to perform administrative tasks on your servers. Also being a web console, it means you can also use it through a mobile device as well.
The Cockpit does not require any special configuration and once installed it is ready to use. You can use it to perform different tasks such as to monitor your system’s current state, manage services, create accounts and many more.
Read Also: How to Install Cockpit Web Console in CentOS 8
In this tutorial, you will see how to install the Cockpit and how to perform some basic tasks with it in RHEL 8 distribution.
Note: This guide assumes that you have root access to your RHEL 8 installation.
How to Install Cockpit in RHEL 8
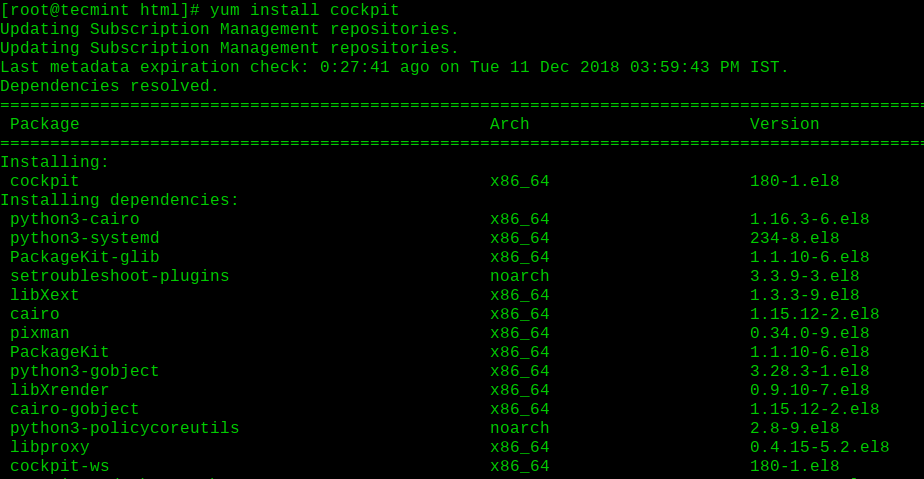
1. With RHEL 8 minimal install, the cockpit is not installed and you can add it to your system by using the command below, which will install the cockpit with its required dependencies.
# yum install cockpit
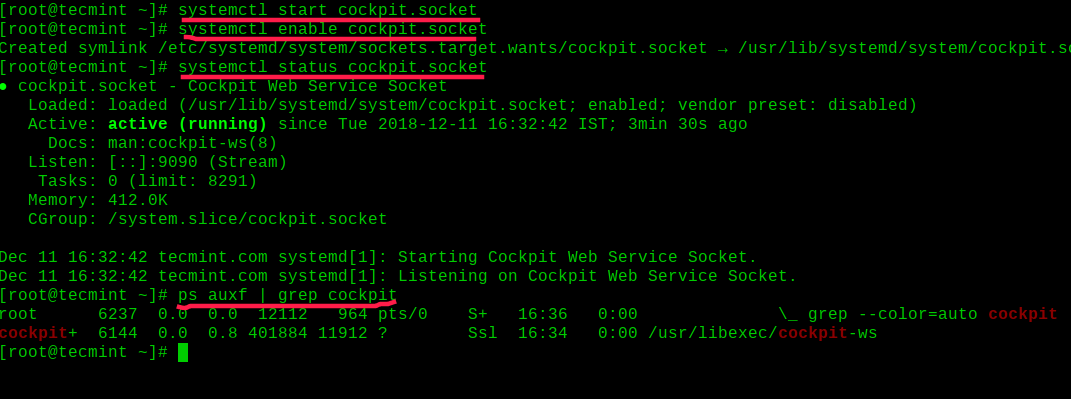
2. Once Cockpit installed, you can start, enable and verify the service and running process using the following commands.
# systemctl start cockpit.socket
# systemctl enable cockpit.socket
# systemctl status cockpit.socket
# ps auxf|grep cockpit
3. To access Cockpit web console, you need to allow the service in the server firewall.
# firewall-cmd --add-service cockpit
# firewall-cmd --add-service cockpit --perm

How to Use Cockpit in RHEL 8
Now we are ready to access the Cockpit web console, by loading http://localhost:9090 or http://server-ip-address:9090 in your browser.
Note that if using a self-signed certificate, you will see a security warning in your browser. It is ok to proceed to the page you are trying to load. If you want to add your own certificate, you can place it in the /etc/cockpit/ws-certs.d directory.
Once you load the page, you should see the following page:
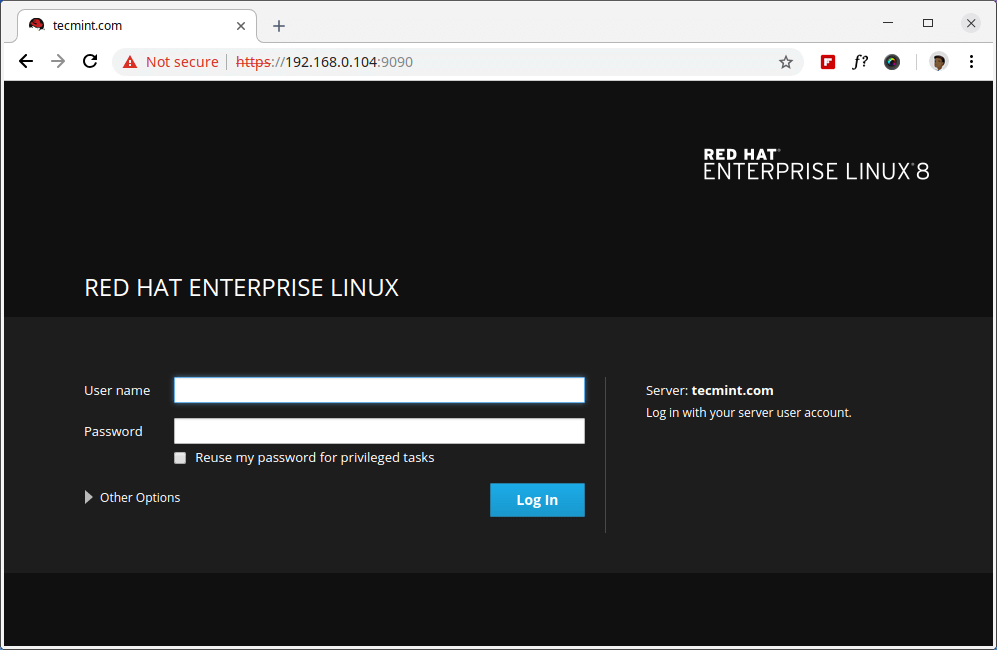
You can authenticate with the user you use to access your RHEL 8 system. If you want to perform administrative tasks, you can authenticate with the root user or a user added to the wheel group.
When you authenticate, you will see the system page, where you will some basic information about your system as well as live updates of your CPU, Memory, Disk I/O and network traffic shown in the graphs:
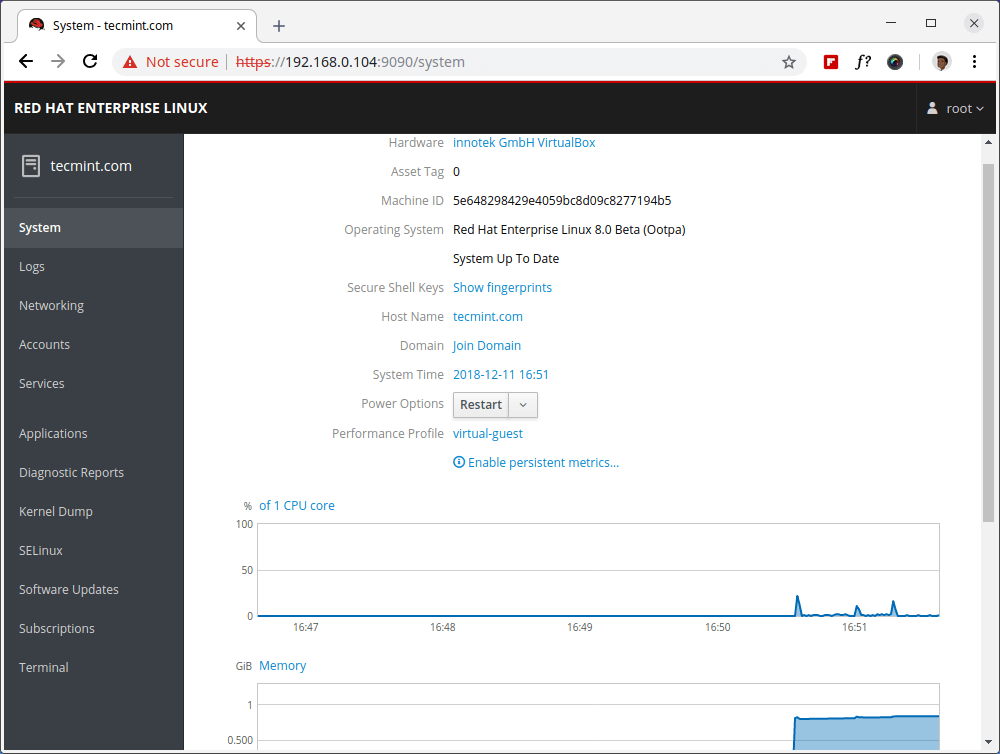
On the left side, you have a few different sections allow you to review:
- Logs – review system logs and filter them by importance.
- Networking – Network stats and services.
- Accounts – create and manage accounts on your system.
- Services – review and manage services on your system.
- Applications – review and manage applications on your system.
- Diagnostic Reports – create a system report for diagnostic purposes.
- Kernel Dump – Enable/disable kdump service and change crash dump location.
- SELinux – Enforce SELinux policy.
- Software updates – check for software updates.
- Subscriptions – check subscription status.
- Terminal – web-based terminal.
We will review each of these sections briefly.
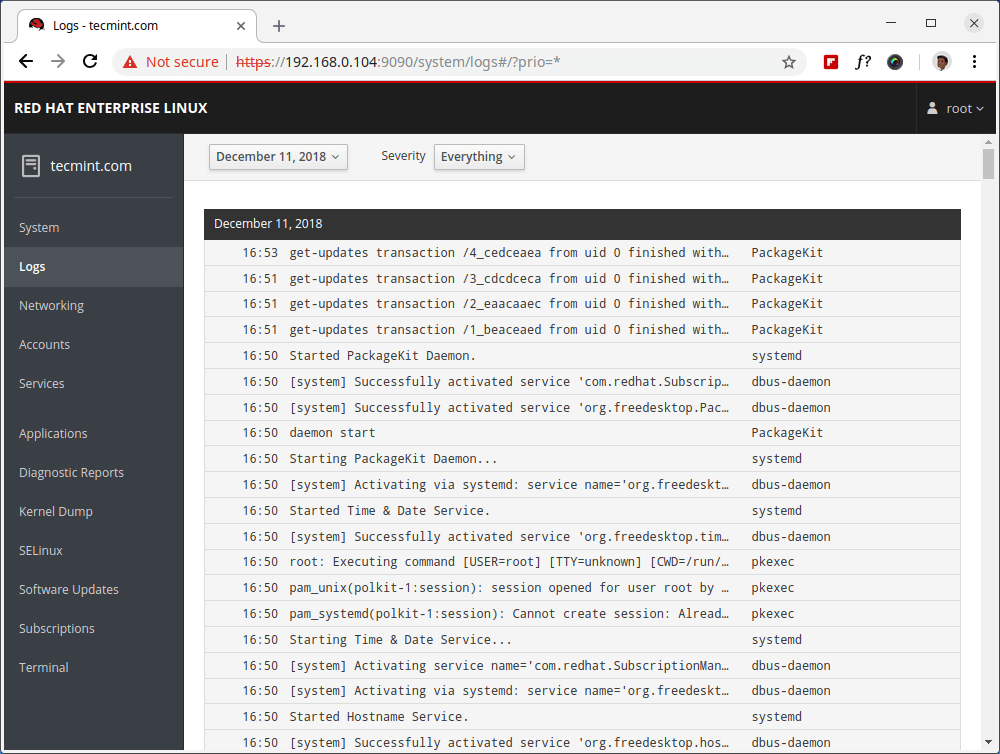
Logs
You can click on each log for more detailed information about the event. Use this section if you want to run debug, review error or alerts. To change the severity of the logs you are reviewing, use the “Severity” drop-down menu.
An overview of the logs page can be seen below:
Networking
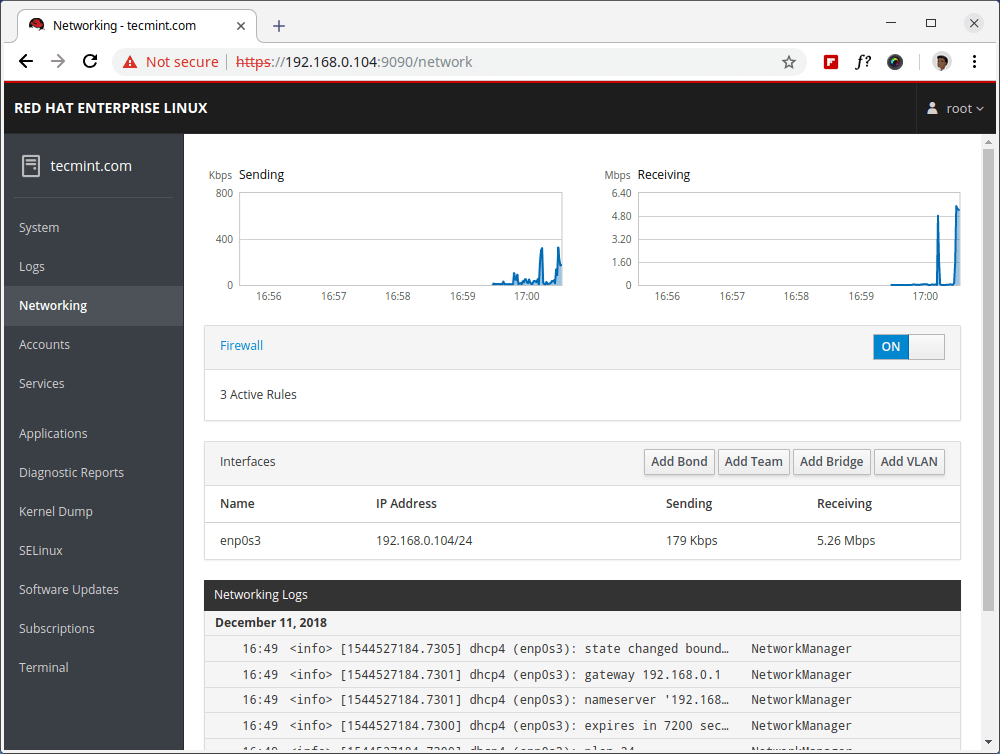
The networking section provides an overview of your current networking usage with graphs and allows you to configure bond, team, bridge, and VLANs. You can enable/disable the firewall or stop specific rules. In the networking logs. In the last block, you can review the networking logs.
Accounts
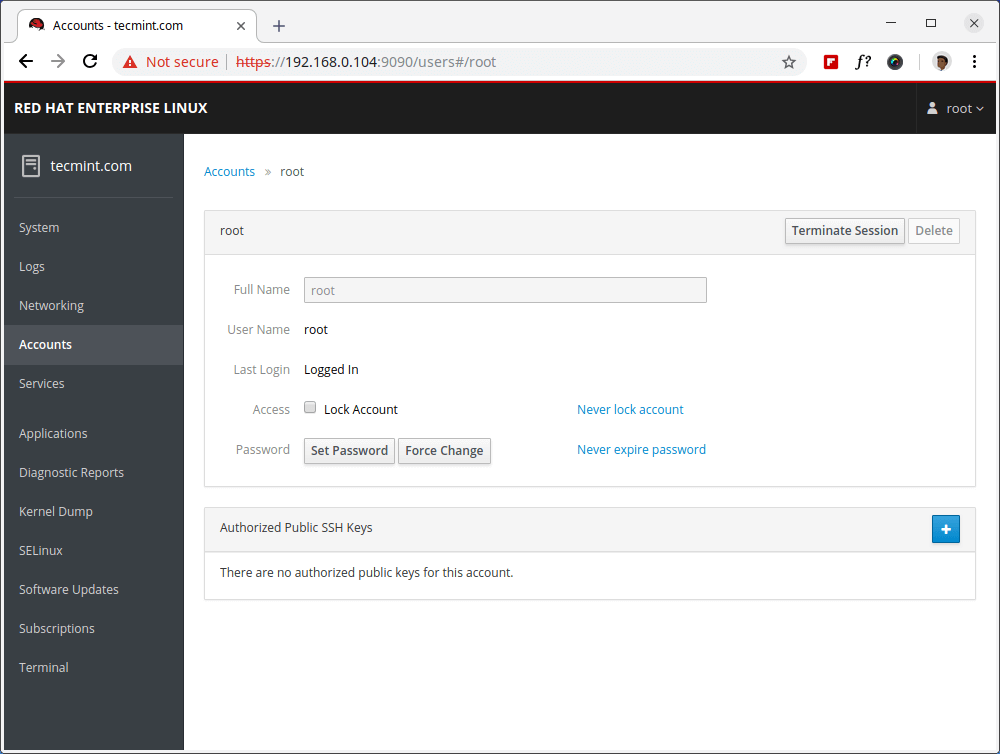
The accounts section allows you to manage accounts on your system. When you click on account, you can modify its settings, change passwords, force password change, lock it or change its role.
Services
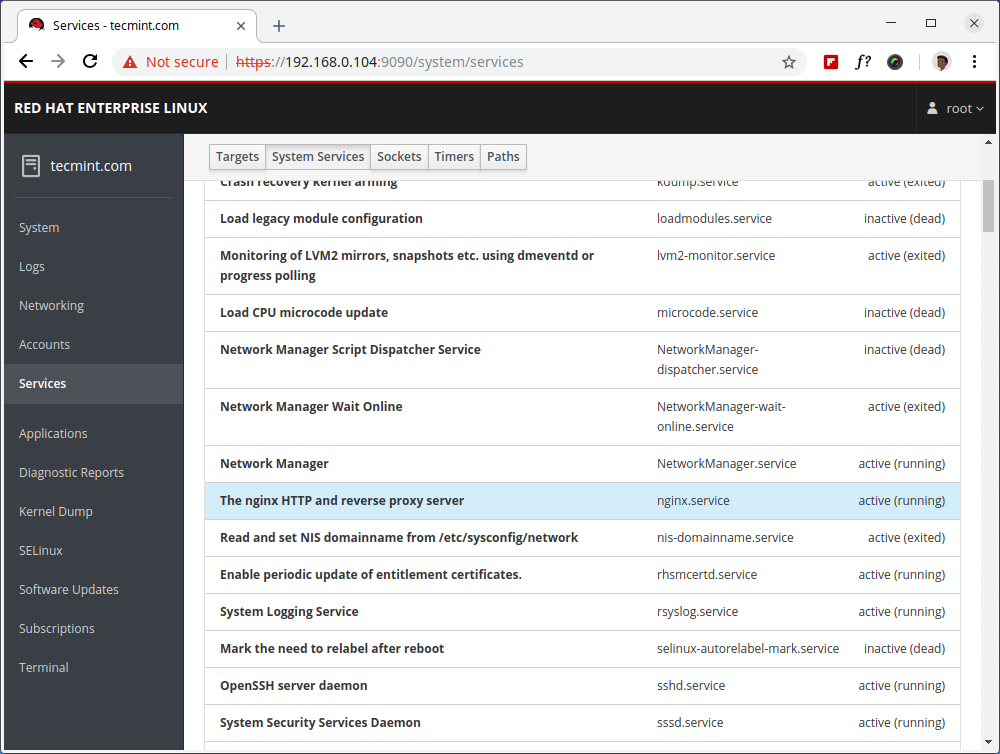
The services section gives you an overview of the services on your system and gives you an easy way to manage them.
Clicking on specific service gives you an overview of its status where you can stop/start, restart, reload, enable/disable that service. You will also see a separate section with that service’s logs:
Diagnostic Reports
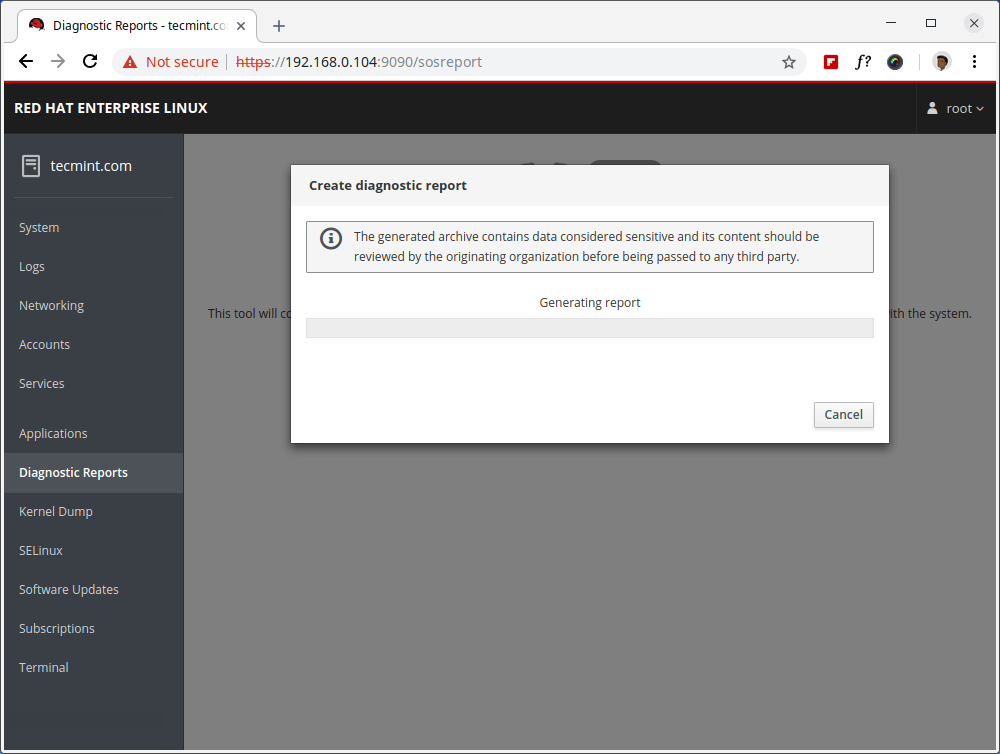
As the name suggests, you can obtain diagnostic information about your system. This can help you troubleshoot problems on your system. In order to use this service, you will need to have the sos utility installed.
# yum install sos
Then click on the “Generate Report” button and wait for the information to be collected.
Kernel Dump
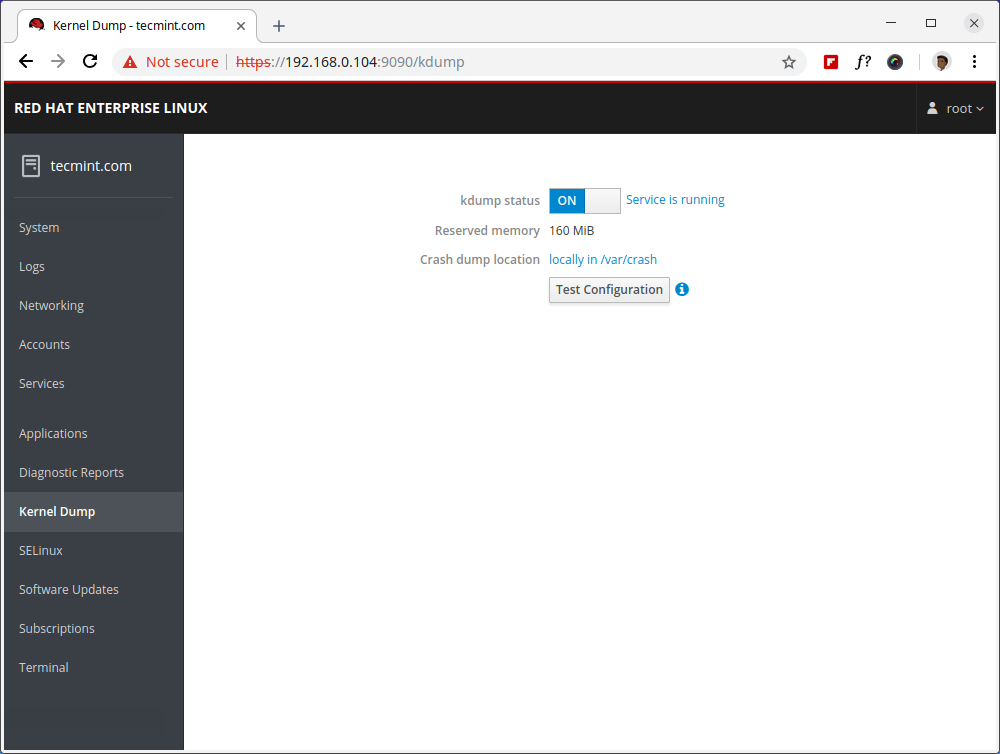
In the Kernel Dump page, you can change the status of the kdump status, change crash dump data location and test the configuration.
SELinux
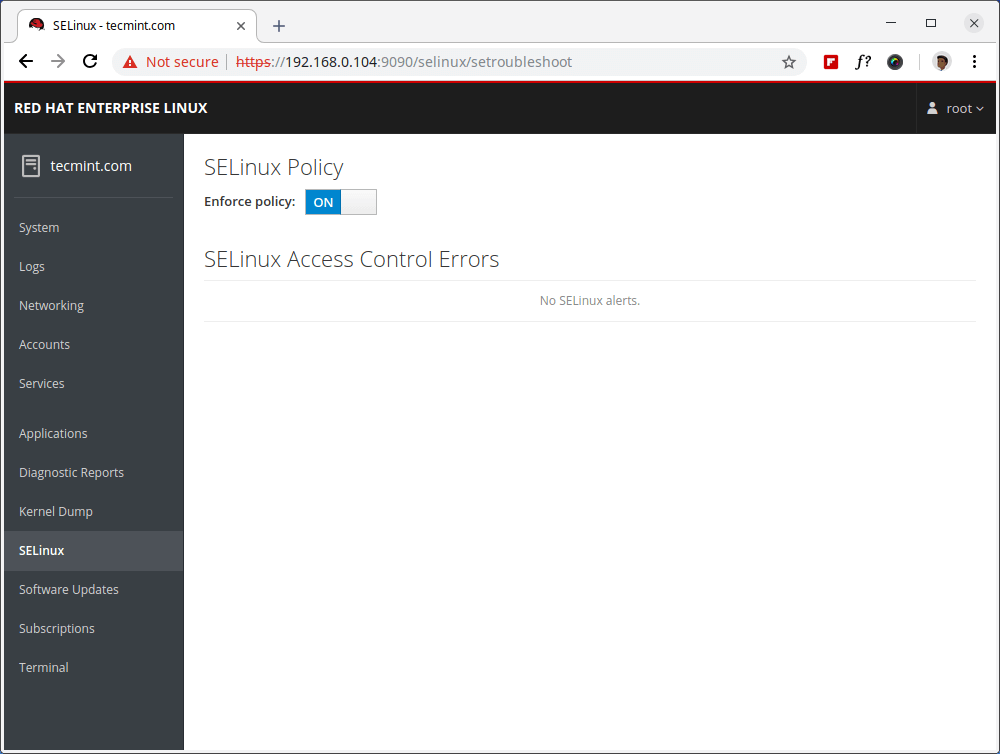
In the SELinux section, you can change the enforce status of SELinux with a simple switch and also review any SELinux related alerts.
Software Updates
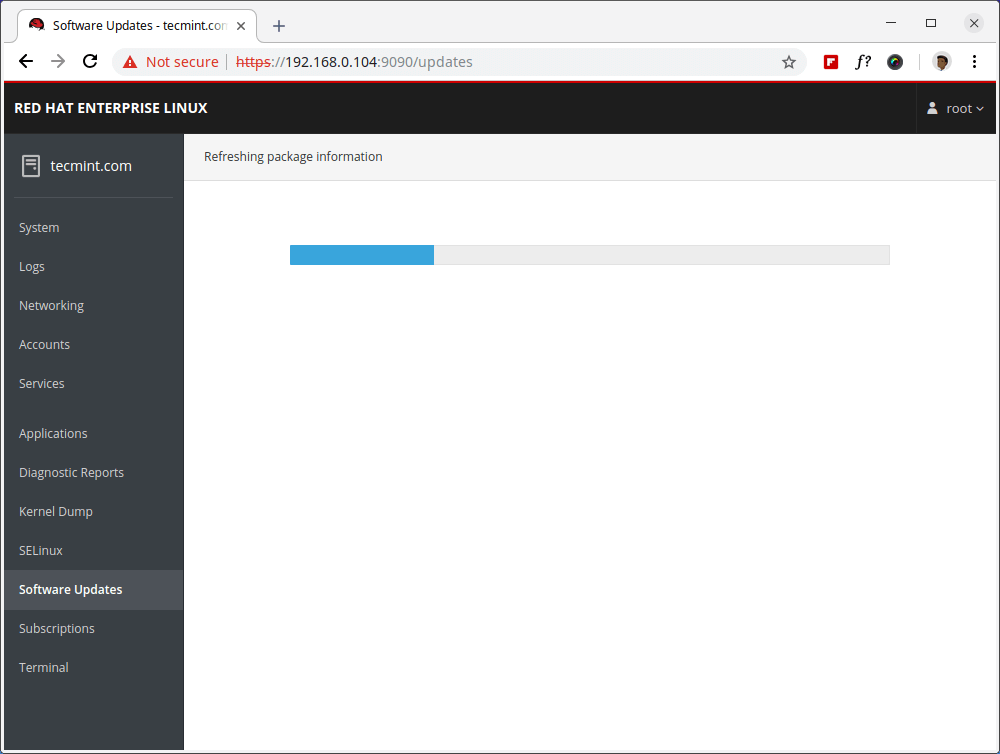
The software updates section gives an overview of packages waiting for an update. You can also force a manual check for updates and enable automatic updates.
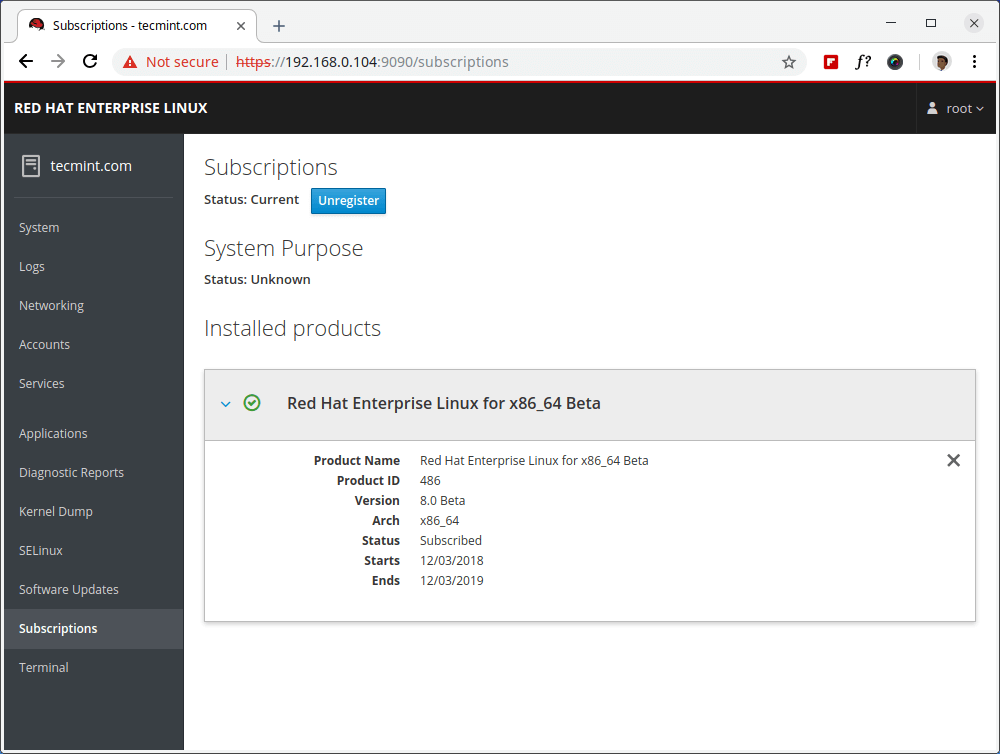
Subscriptions
Here you can see your RHEL subscription status and purpose. You can also unregister the system using a single button.
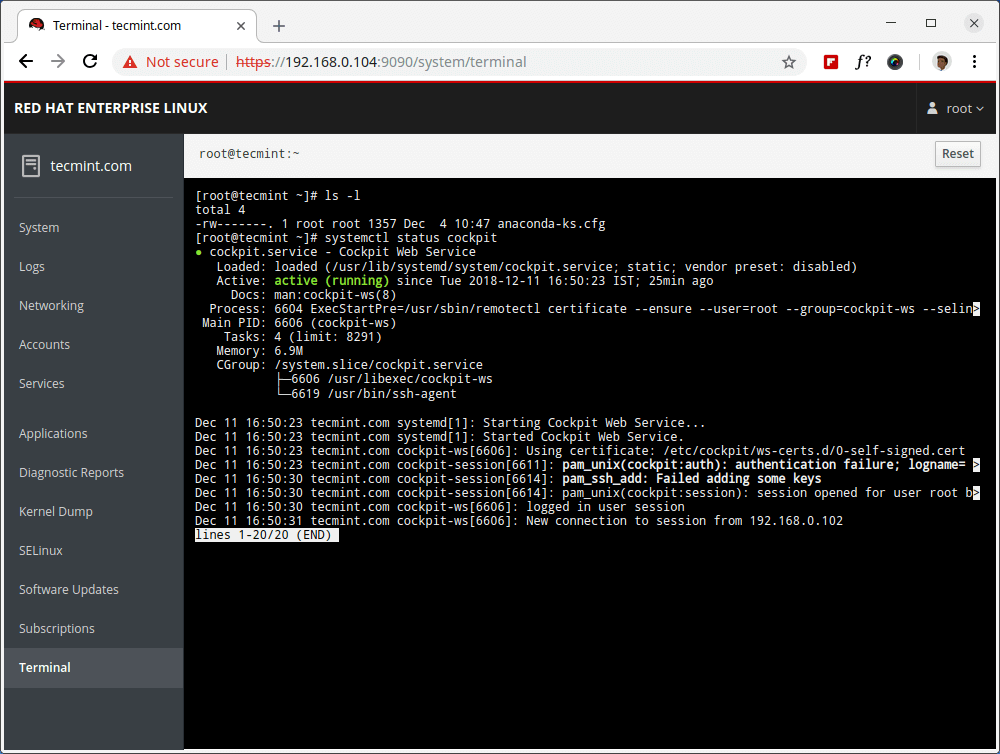
Terminal
Terminal section gives you what it says – a terminal. You can use this instead of connecting over SSH. It is useful if you need to run a few commands within a browser.
That’s It! Cockpit is a lightweight web console that gives you an easy way to perform different administrative tasks on your RHEL 8 system.


Hello, Good One, Worked for me, Thank you
May I use this apllcation for Debian based platforms?
@Alexey,
Yes, you can install Cockpit on Debian using following commands.
Access cockpit web interface at
http://[ServerIP|Hostname]:9090.If you have a running UFW firewall service, allow port 9090.
Thank you!
Very useful information.
Very nice and helpful