A Pandora FMS Agent is an application installed on computers to be monitored using the Pandora FMS Monitoring System. Software agents perform checks on server resources (such as CPU, RAM, storage devices, etc.) and installed applications and services (such as Nginx, Apache, MySQL/MariaDB, PostgreSQL, etc.); they send the collected data to the Pandora FMS Servers in XML format using one of the following protocols: SSH, FTP, NFS, Tentacle (protocol) or any other data transfer means.
Note: Agents are only needed for server and resource monitoring, while network equipment monitoring is done remotely thus no need to install software agents.
This article shows how to install Pandora FMS software agents and connect them to a Pandora FMS Server instance for monitoring. This guide assumes that you already have a running instance of a Pandora FMS server.
Installing Pandora FMS Agents in Linux Systems
On CentOS and RHEL distributions, run the following commands to install the required dependencies packages, then download the latest version of the Pandora FMS agent RPM package and install it.
# yum install wget perl-Sys-Syslog perl-YAML-Tiny
# wget https://sourceforge.net/projects/pandora/files/Pandora%20FMS%207.0NG/743/RHEL_CentOS/pandorafms_agent_unix-7.0NG.743-1.noarch.rpm
# yum install pandorafms_agent_unix-7.0NG.743-1.noarch.rpm
On Ubuntu and Debian distributions, issue the following commands to download the latest agent DEB package and install it.
$ wget https://sourceforge.net/projects/pandora/files/Pandora%20FMS%207.0NG/743/Debian_Ubuntu/pandorafms.agent_unix_7.0NG.743.deb
$ sudo dpkg -i pandorafms.agent_unix_7.0NG.743.deb
$ sudo apt-get -f install
Configuring Pandora FMS Agents in Linux Systems
After successfully installing the software agent package, configure it to communicate with the Pandora FMS server, in the /etc/pandora/pandora_agent.conf configuration file.
# vi /etc/pandora/pandora_agent.conf
Look for the server configuration parameter and set its value to the IP address of the Pandora FMS server as shown in the following screenshot.
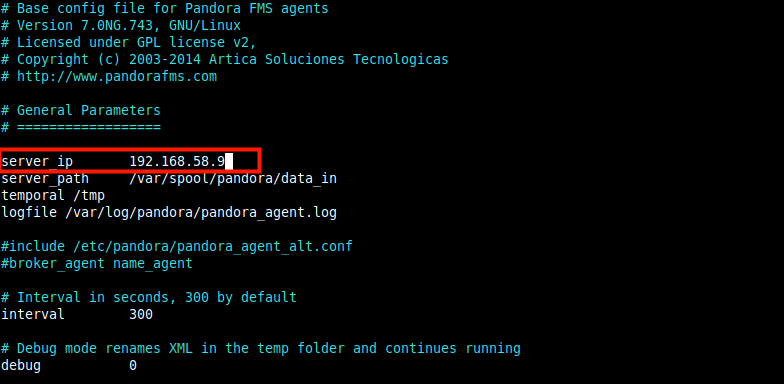
Save the file and then start the Pandora agent daemon service, enable it to auto-start at system boot and verify the service is up and running.
# systemctl start pandora_agent_daemon.service
# systemctl enable pandora_agent_daemon.service
# systemctl status pandora_agent_daemon.service
Adding New Agent to Pandora FMS Server
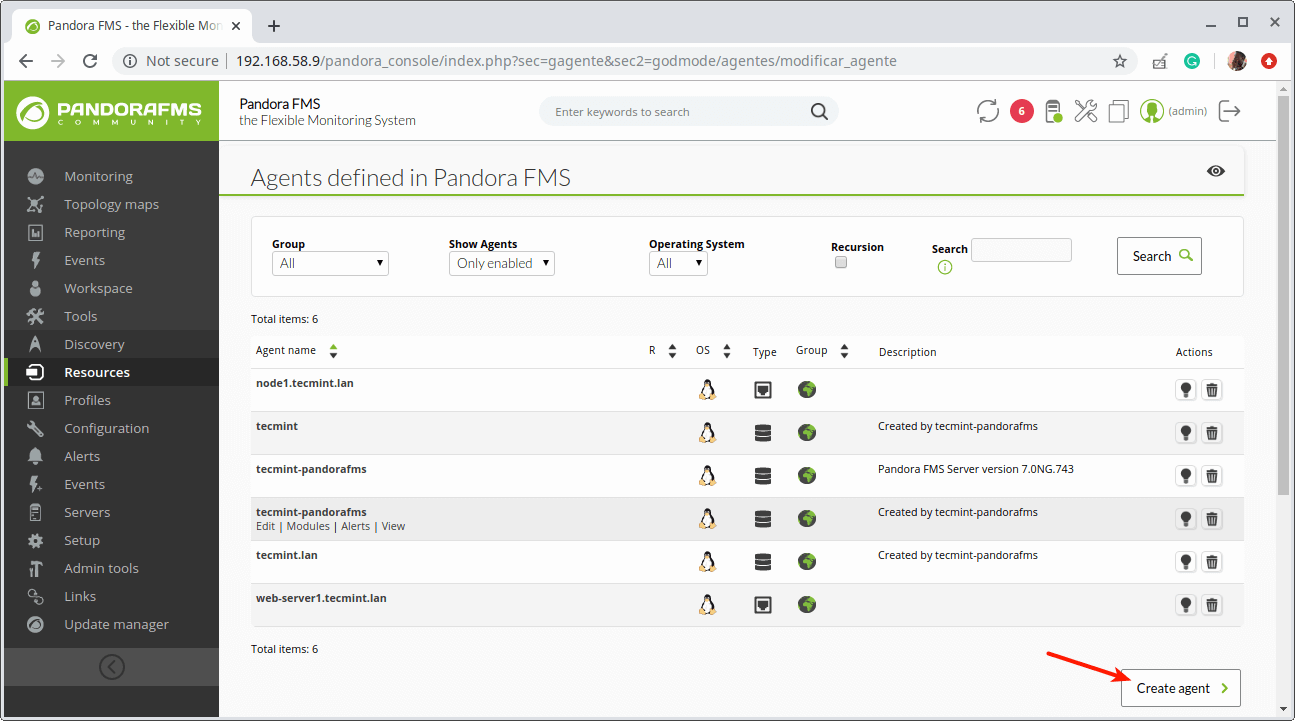
Next, you need to add the new agent via the Pandora FMS console. Go to the web browser and log into the Pandora FMS server console and then go to Resources ==> Manage Agents.
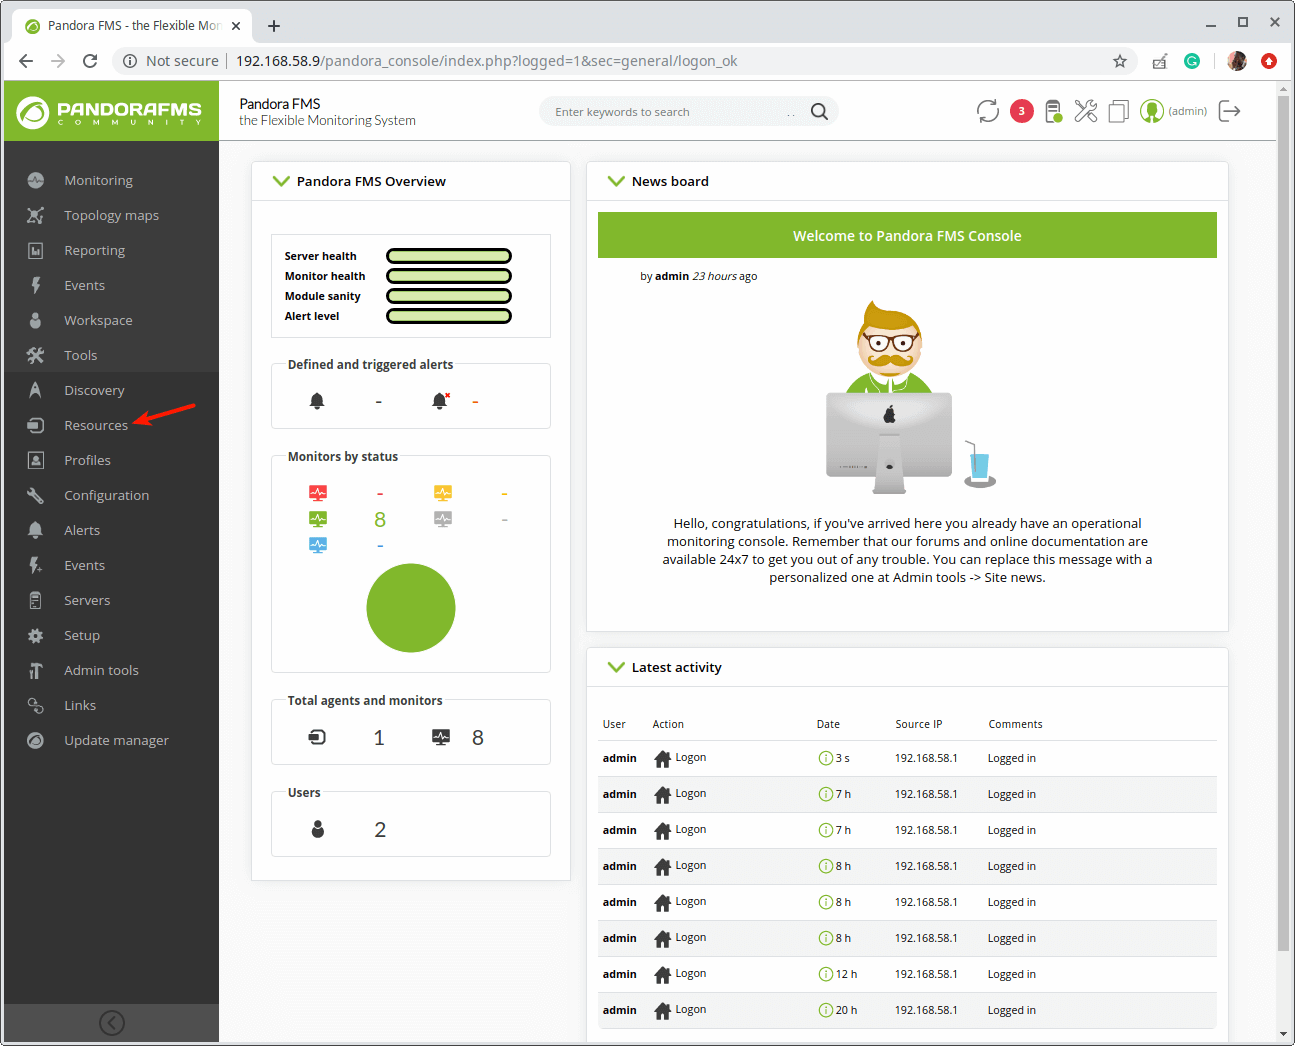
From the next screen, click on Create agent to define a new agent.
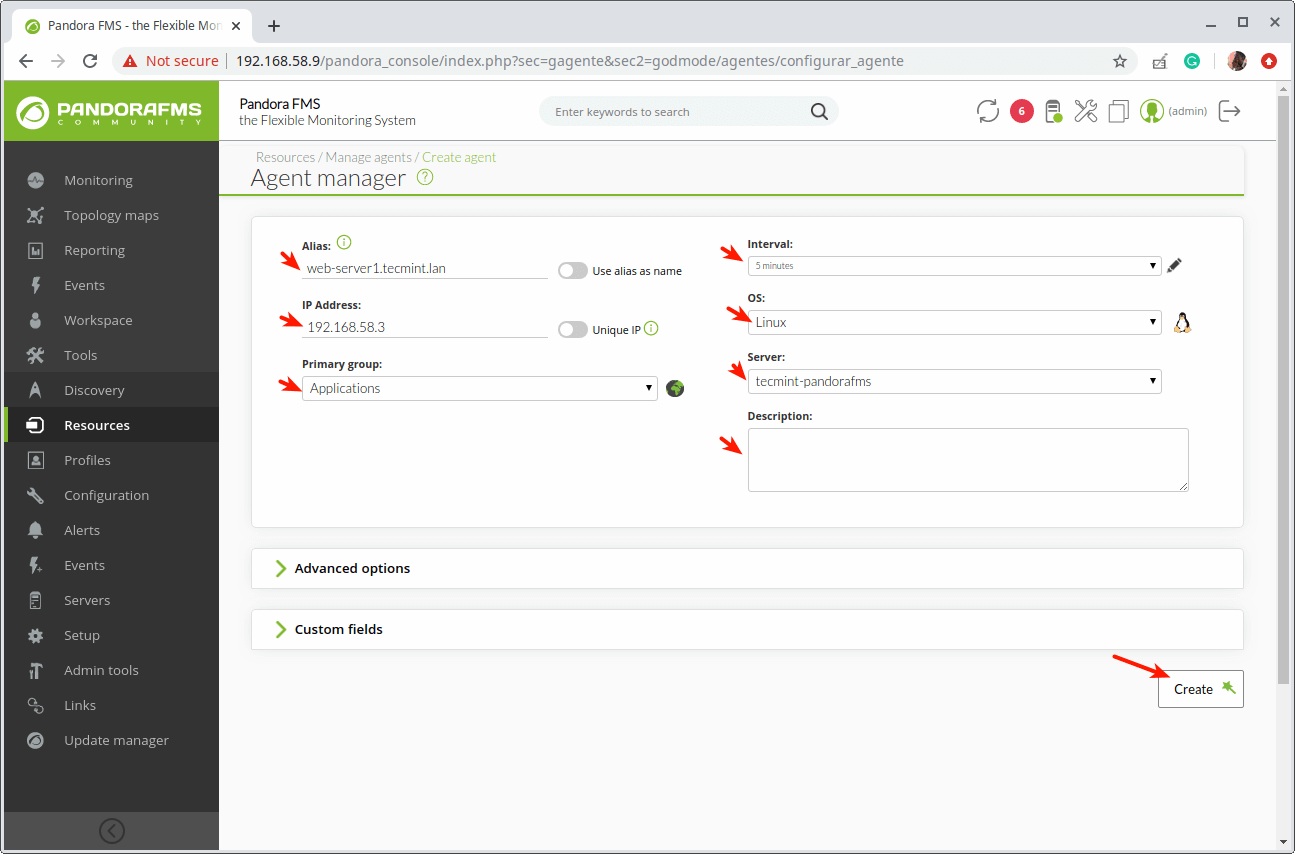
At the Agent Manager page, define a new agent by filling the form as shown in the following screenshot. Once you are done, click on Create.
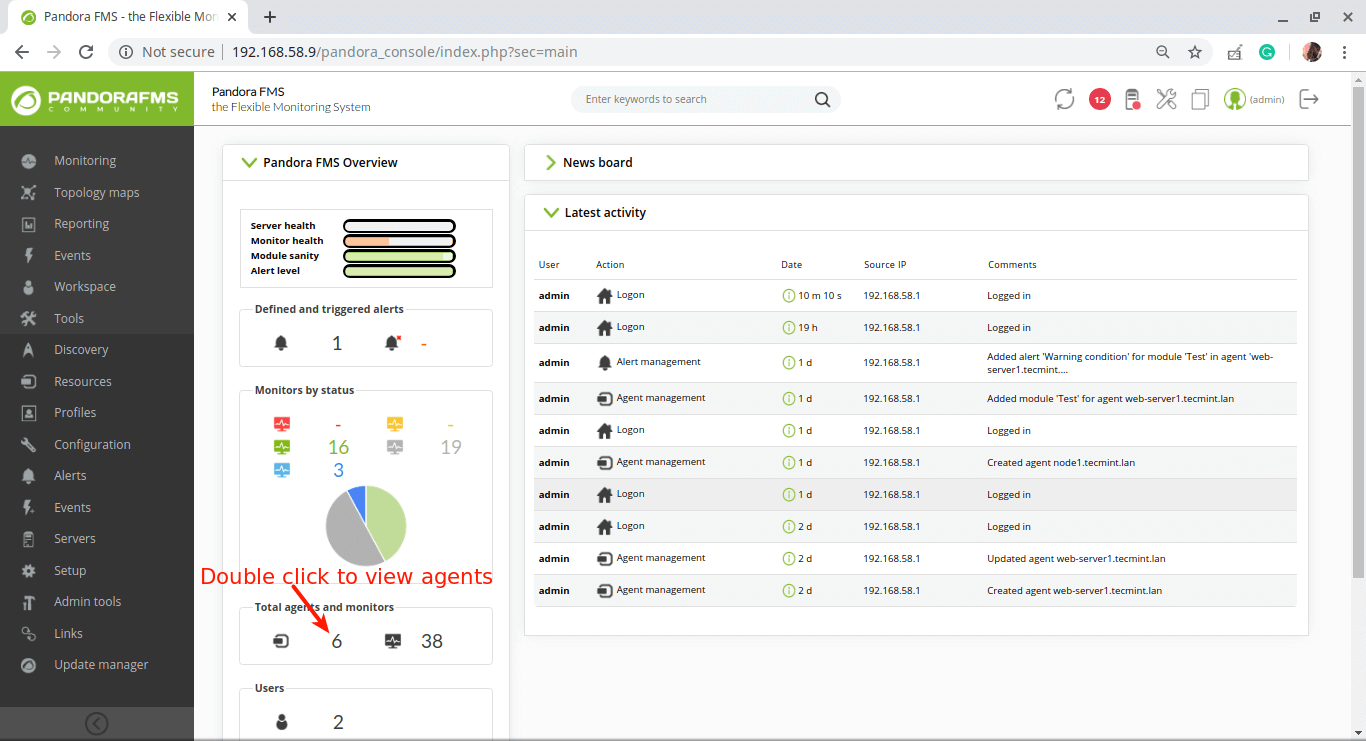
After adding agents, they should reflect in the front page summary as highlighted in the following screenshot.
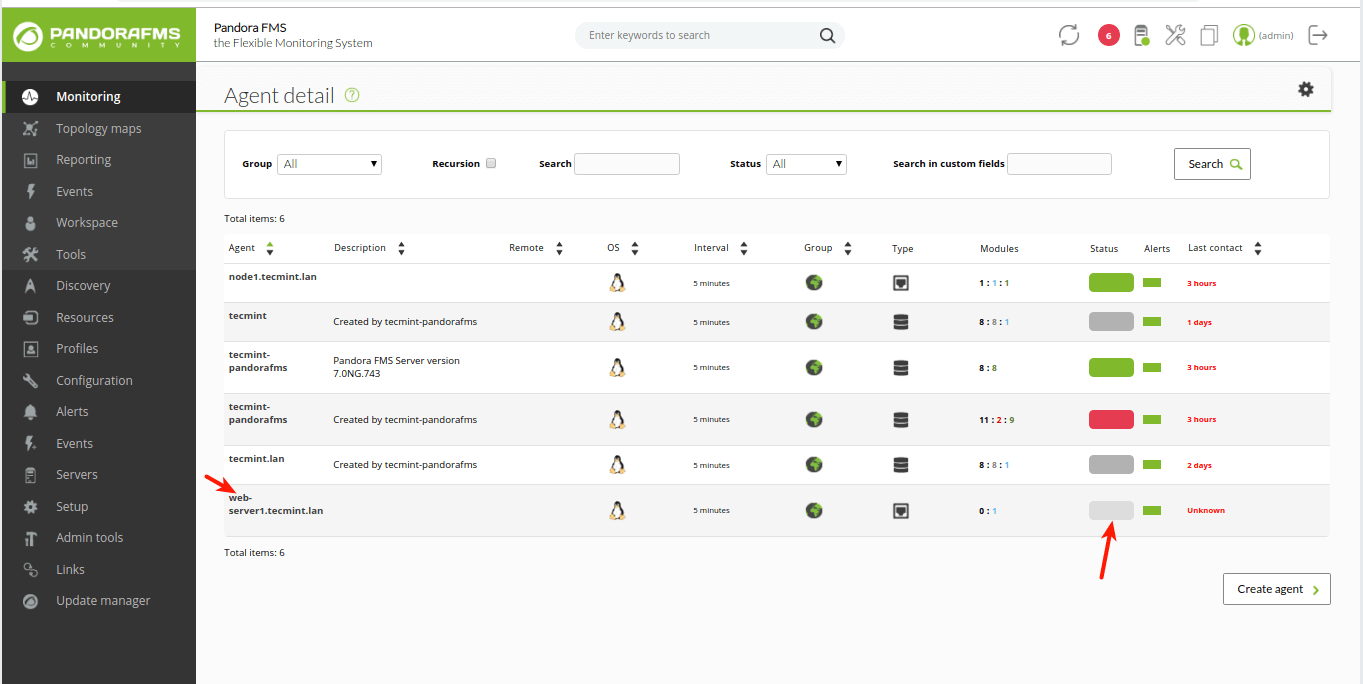
If you view the newly created agent under Agent details and highlight its status indicator, it should show no monitors. So you need to create modules for monitoring the host the agent is running on, as explained in the next section.
Configuring a Module for Remote Agent Monitoring
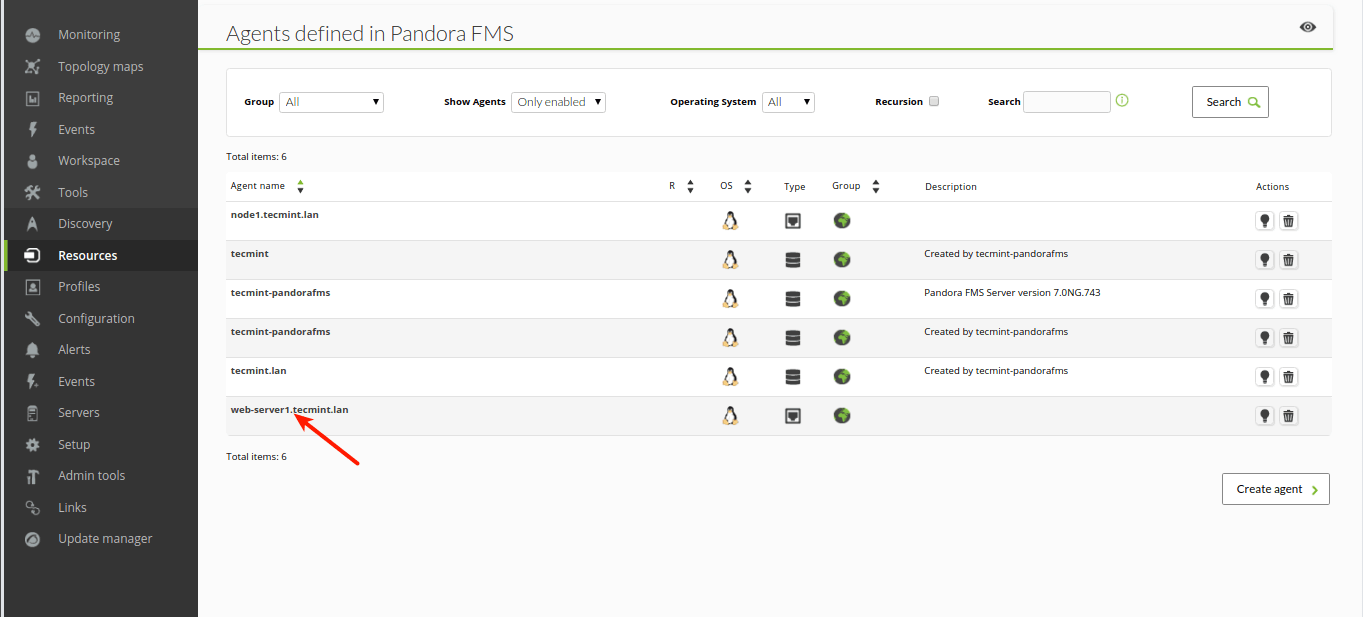
For this guide, we will create a module to check if the remote host is live (can be pinged). To create a module, go to Resource ==> Manage agents. At the Agents defined in the Pandora FMS screen, click on the agent name to edit it.
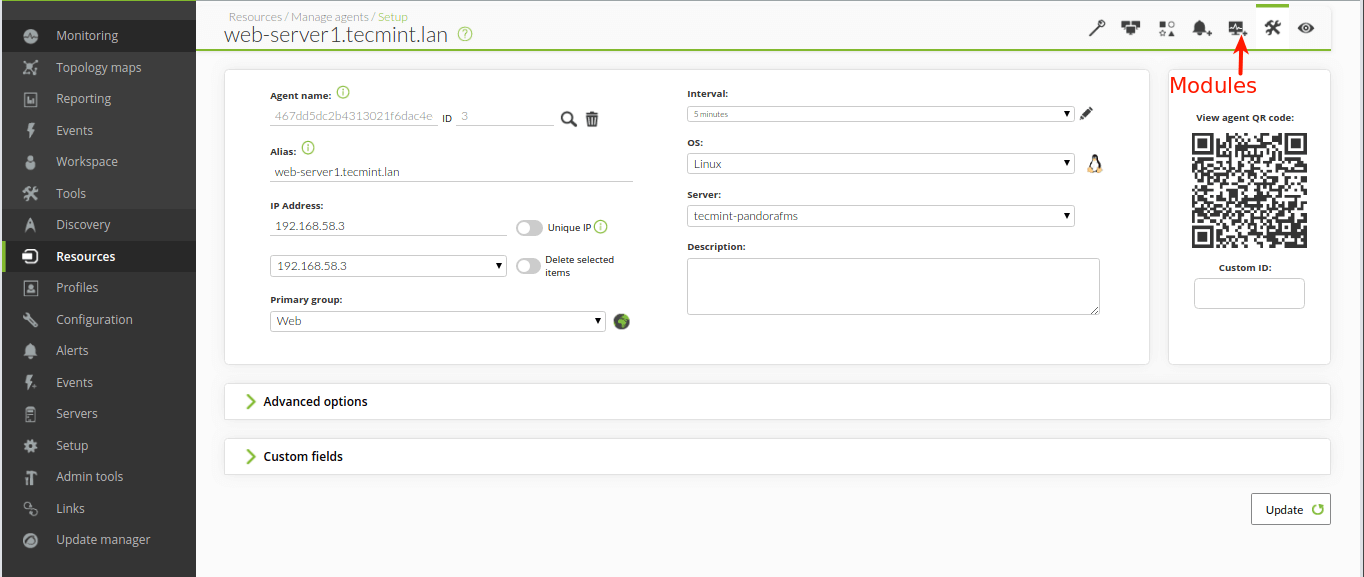
Once it loads, click on the Modules link as highlighted in the following screenshot.
Then select the module type (e.g Create a new network server module) from the next screen and click Create.

From the next screen, select the module component group (e.g Network Management) and its actual check type (e.g Host Alive). Then fill in the other fields, and ensure that the Target IP is of the host to be monitored. Then click Create.
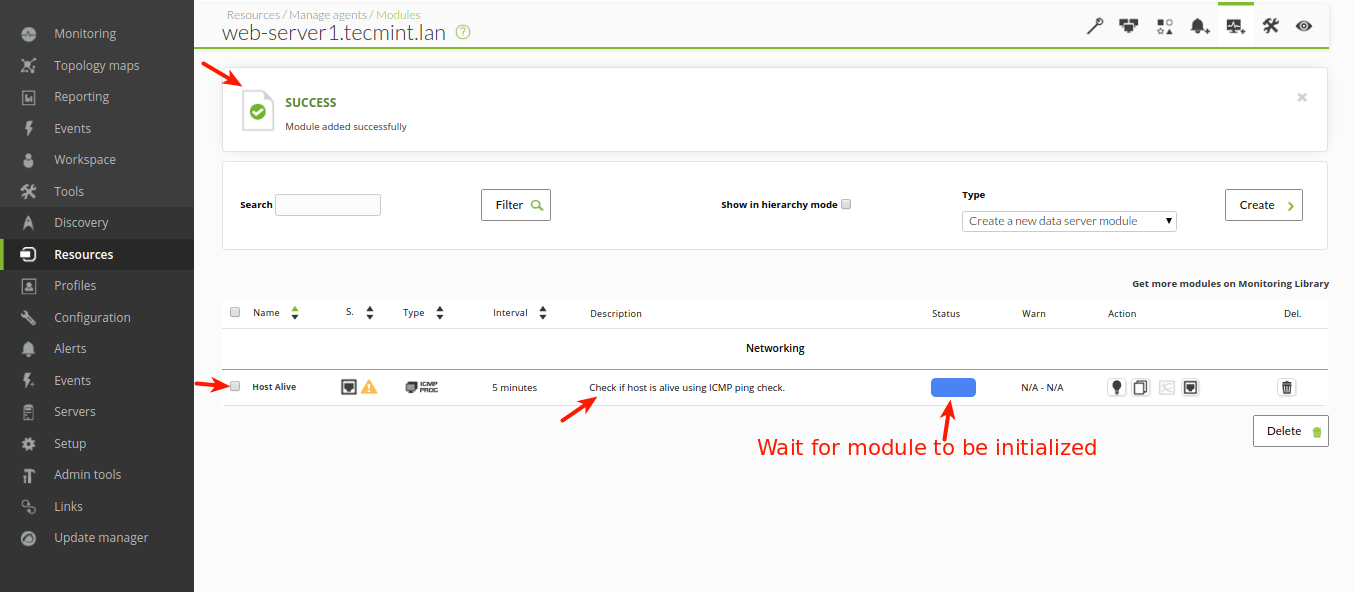
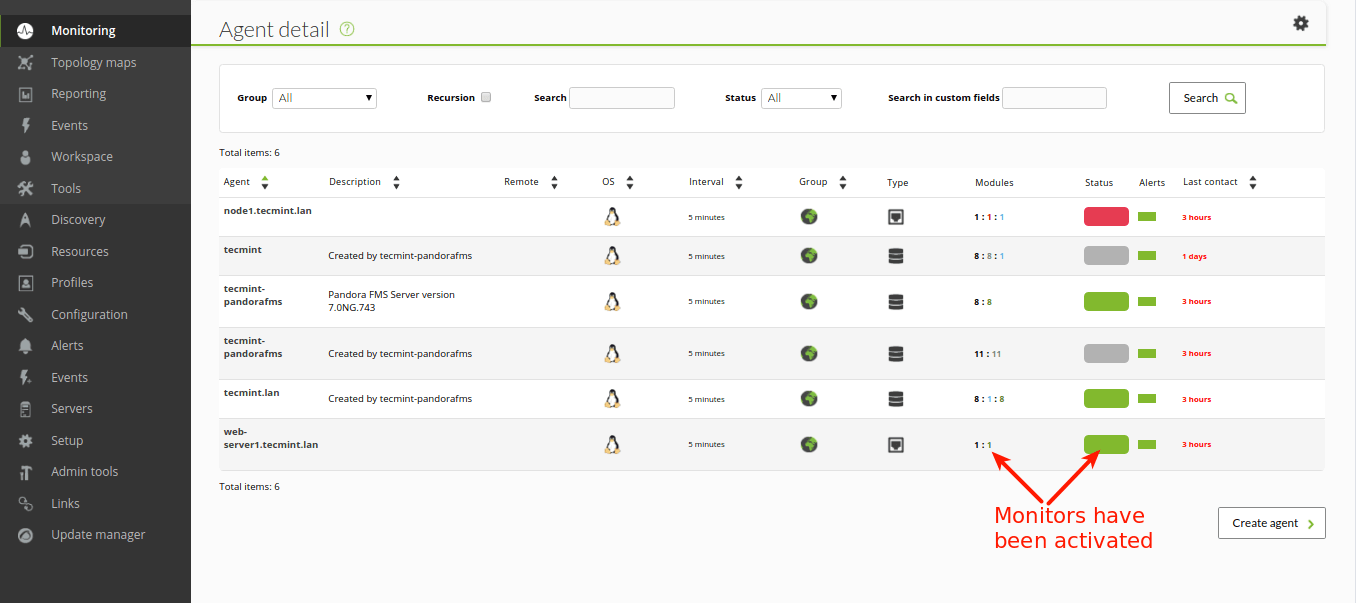
Next, refresh the console and try to view the agent under Agent details, and highlight its status indicator, it should show “All monitors are OK”. And under modules, it should show that there is one module that is in a normal state.
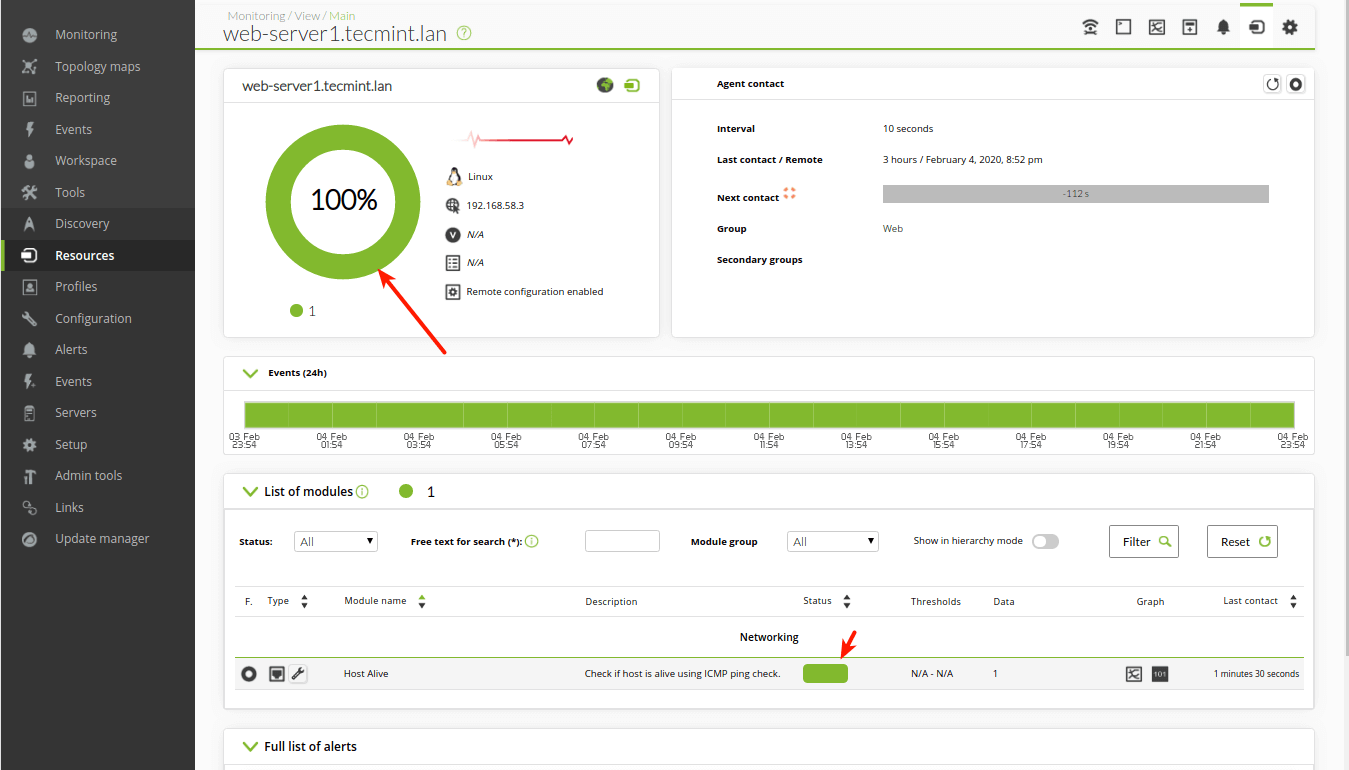
When you open the agent now, it should display some monitoring information as highlighted in the following screenshot.
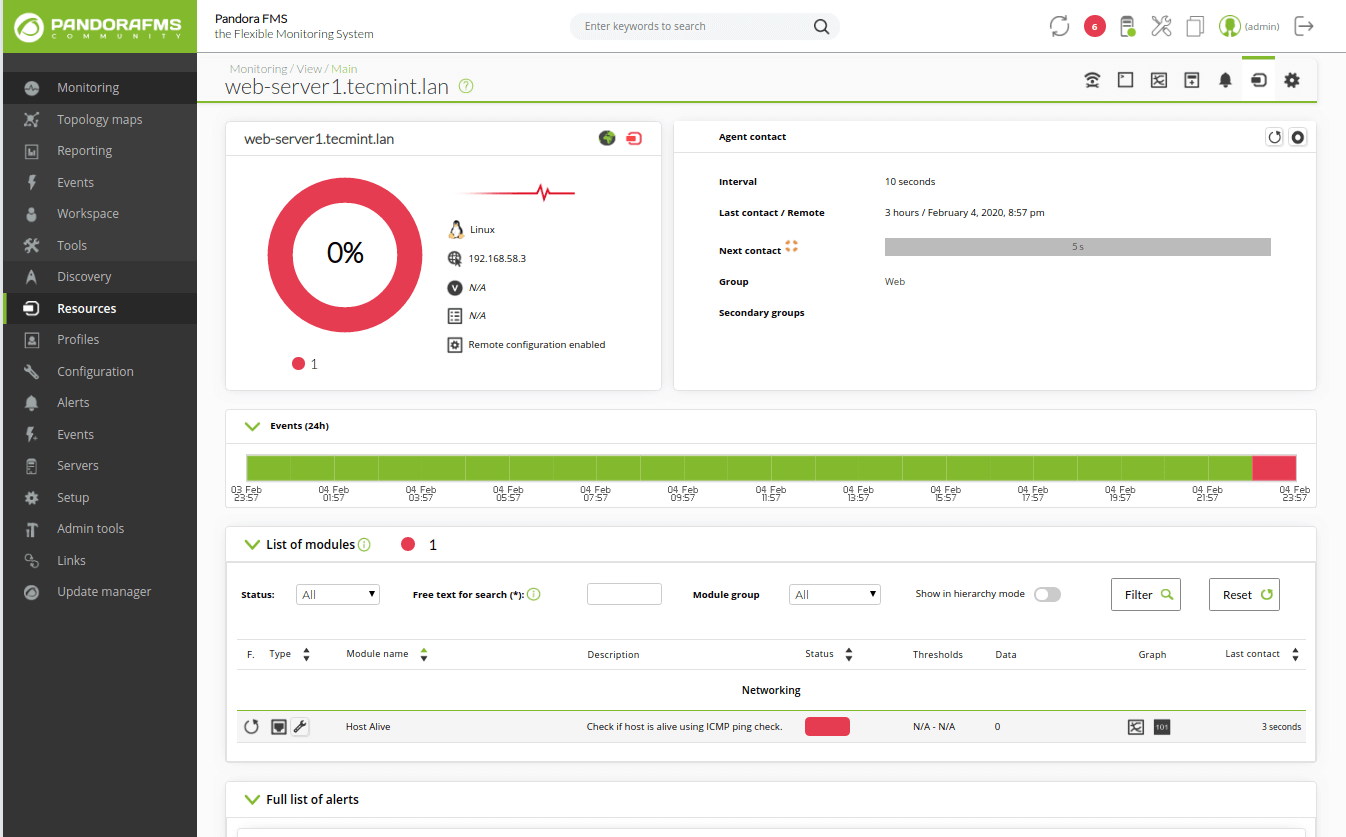
To test if the module is working fine, you can shut down the remote host and reset the modules for the agent. It should indicate a critical status (RED color).
That’s all! The next step is to learn how to use advanced features of the PandoraFMS system and configure it to monitor your IT infrastructure, by creating more servers, agents and modules, alerts, events, reports, and so much more. For more information, see the PandoraFMS documentation.



Hello, I did following the tutorial that you have provided, but, after selecting the module agent, there will be the next page called base option. And there are plenty of blanks that I need to fulfill until then I just inserting what the tutorial stated (host alive) and so on. But still, I can’t initialize the module. It still blue in color. How can I solve the problem, I have done ping the IP Add and it exists, turn off the firewall but then still not running.
@Dummy
I can’t replicate your issue. Try to restart the Pandora_agent-daemon service:
Then refresh the PandoraFMS console.
For more information, see the official documentation: https://pandorafms.com/docs/index.php?title=Pandora:Documentation_en:Remote_Monitoring