In this article, we will take a look at gdu an open-source disk usage analyzer written in go. Gdu is inspired by godu, dua, ncdu, and df.
The gdu tool is created for SSD drives where parallel processing can be utilized. This tool can also work with HDD with less performance compared to SSD drives. You can also check benchmark results. There are many other similar tools and you have to play with gdu first to see if satisfy your needs.
How to Install Gdu – Linux Disk Usage Analyzer
There are few different ways to install gdu in different Linux flavors but I am going to stick with a common way that can be followed irrespective of what distribution you are running with.
Go to the gdu GitHub release page to download the archive file. The latest version is V4.9.1 and I suggest downloading the latest version.
$ curl -L https://github.com/dundee/gdu/releases/latest/download/gdu_linux_amd64.tgz | tar xz
$ chmod +x gdu_linux_amd64
$ sudo mv gdu_linux_amd64 /usr/bin/gdu
Now you can verify the installation by running the following command.
$ gdu --version

Version:        v4.9.1
Built time:     Sat Mar 27 09:47:28 PM  CET 2021
Built user:     dundee
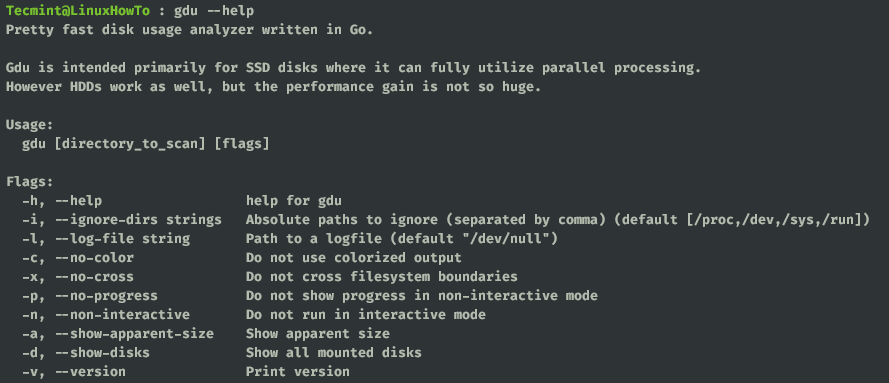
A good practice before playing with any new tools is to check the help options.
$ gdu --help
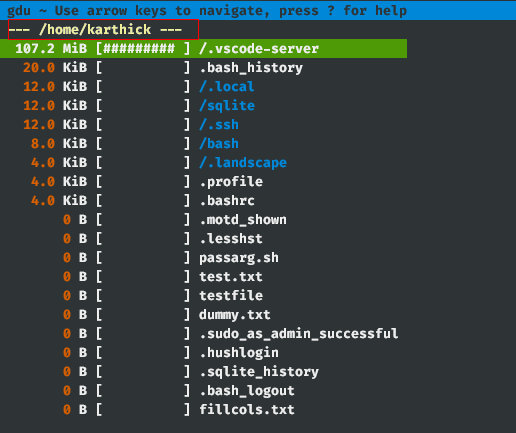
If you run the gdu command without passing any argument it will scan your current working directory. I am in my home directory now and when I run gdu, you can see from the below image my home directory is scanned.
$ gdu
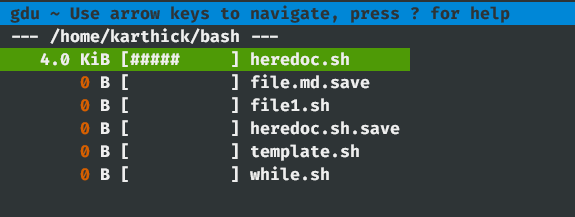
To scan for any particular directories you have to pass the directory name as an argument.
$ gdu /home/tecmint/bash
You cannot pass more than one argument.
$ gdu /home /var
There are few operations you can perform with the gdu command. Press ? to access help.
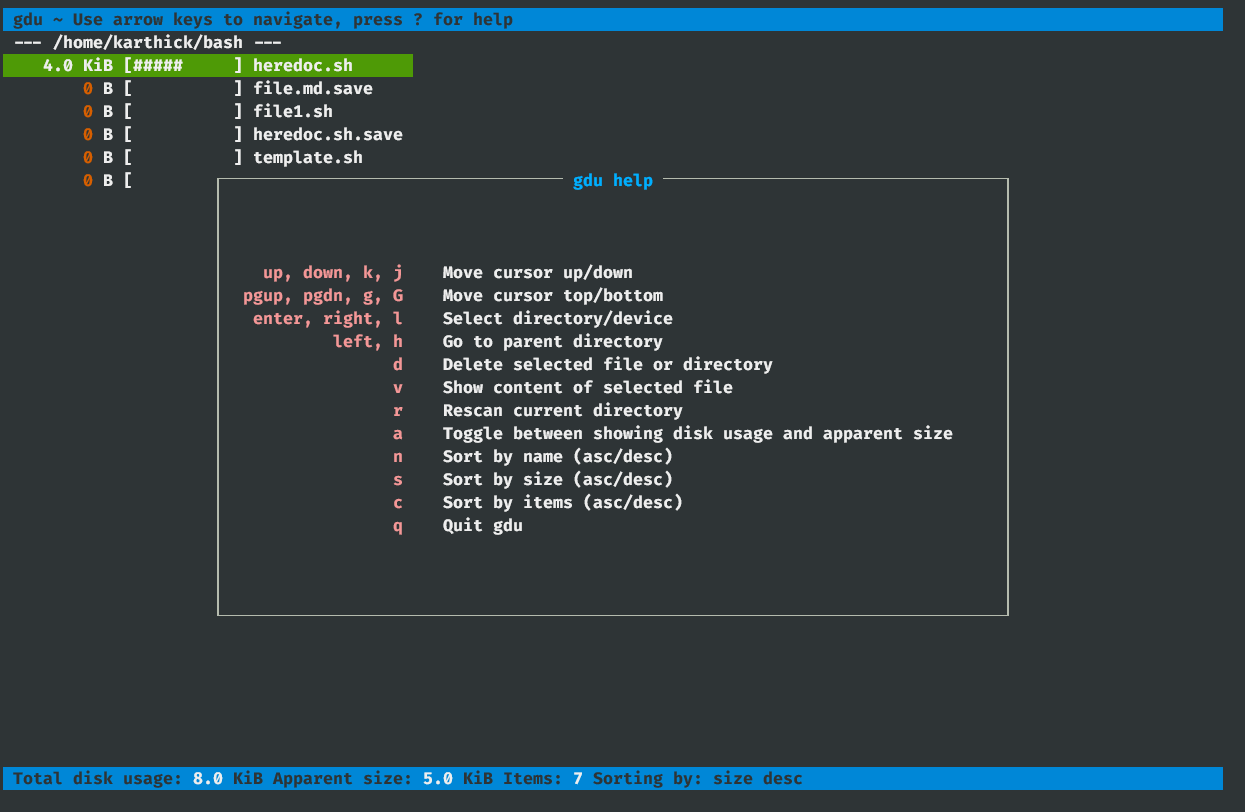
From the help you can see, there are options to sort, scan and move across directories. Access help and try exploring all the options to get comfortable.
You can delete a file or directory by pressing the “d" key. It will prompt you for confirmation.
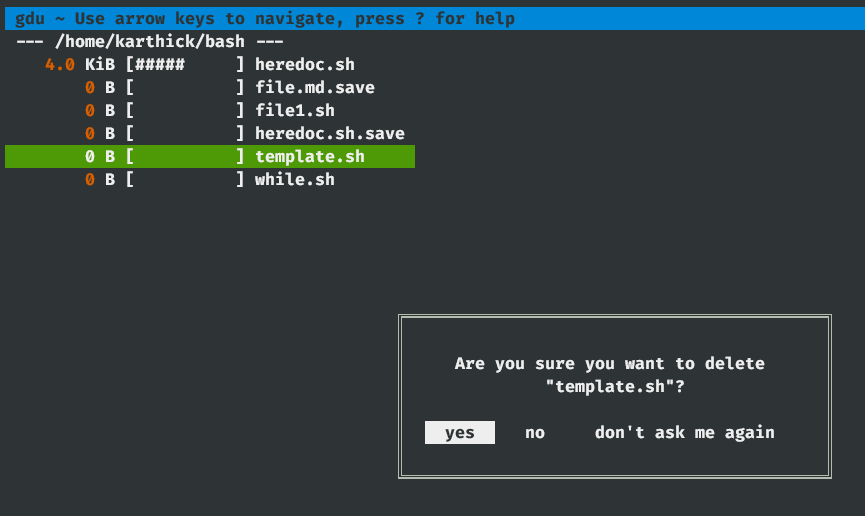
You can also view the content of any file by pressing the “v" key. To come out of the file press the escape key.

You can ignore certain directories from the output by adding directory names as an argument to the -i flag. Multiple directories can also be passed to the -i flag and each directory should be separated by commas.
$ gdu /home/karthick/ -i /home/karthick/.ssh,/home/karthick/sqlite
You may see special characters in the files and directories and each has a special meaning. From the below example you can see the “/network” directory is empty so the character “e” is prefixed to denote that.
[ ! ] ⇒ Error while reading directory
[ . ] ⇒ Error while reading subdirectory.
[ @ ] ⇒ File is socket or simlink.
[ H ] ⇒ Hardlink which is already counted.
[ e ] ⇒ Empty directory.
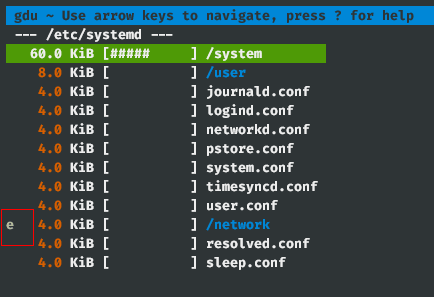
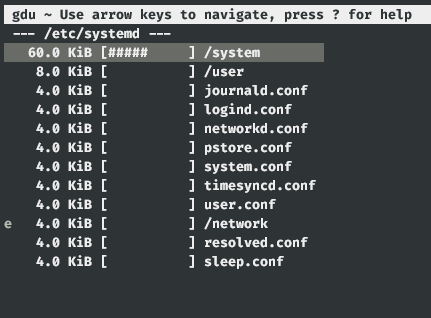
If you like black and white output, you can use “-c" flag. See the below image where the output is printed in black and white.
$ gdu -c /etc/systemd
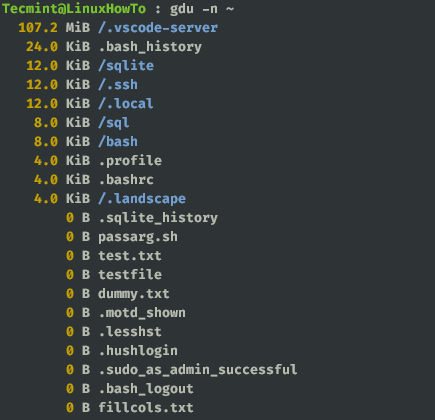
All the commands till now will launch an interactive mode to show disk stats. If you want the output in non-interactive mode use the “-n" flag.
$ gdu -n ~
That’s it for this article. Play with gdu and let us know how it suits your needs compared to other disk usage tools.




On Debian 10, I’m using ncdu which offers quite the same features. ncdu is in the repo
Screenshots:
https://screenshots.debian.net/package/ncdu#gallery-1Thank, great tool indeed. I like DUC as well, but I prefer the keybindings of GDU. Nice find!
@Koos
Thanks for the feedback :)
Hi,
Thanks a lot.
@Jalal
Your welcome :)