A system administrator’s routine tasks include configuring, maintaining, troubleshooting, and managing servers and networks within data centers. There are numerous tools and utilities in Linux designed for administrative purposes.
In this article, we will review some of the most used command-line tools and utilities for network management in Linux, under different categories. We will explain some common usage examples, which will make network management much easier in Linux.
On this page
- ifconfig Command
- ip Command
- ifup Command
- ethtool Command
- ping Command
- traceroute Command
- mtr Command
- route Command
- nmcli Command
- netstat Command
- ss Command
- nc Command
- nmap Command
- host Command
- dig Command
- nslookup Command
- tcpdump Command
- Wireshark Utility
- bmon Tool
- iptables Firewall
- firewalld
- UFW Firewall
- How to Use Nmap Script Engine (NSE) Scripts in Linux
- A Practical Guide to Nmap (Network Security Scanner) in Kali Linux
- Find Out All Live Hosts IP Addresses Connected on Network in Linux
- Basic Guide on IPTables (Linux Firewall) Tips / Commands
- 25 Useful IPtable Firewall Rules Every Linux Administrator Should Know
- How To Setup an Iptables Firewall to Enable Remote Access to Services
- How to Block Ping ICMP Requests to Linux Systems
- Useful ‘FirewallD’ Rules to Configure and Manage Firewall in Linux
- How to Configure ‘FirewallD’ in RHEL/CentOS 7 and Fedora 21
- How to Start/Stop and Enable/Disable FirewallD and Iptables Firewall in Linux
- Setting Up Samba and Configure FirewallD and SELinux to Allow File Sharing on Linux/Windows
This list is equally useful to full-time Linux network engineers.
Network Configuration, Troubleshooting, and Debugging Tools
1. ifconfig Command
ifconfig is a command-line interface tool for network interface configuration and is also used to initialize interfaces at system boot time. Once a server is up and running, it can be used to assign an IP Address to an interface and enable or disable the interface on demand.
It is also used to view the IP Address, Hardware / MAC address, as well as MTU (Maximum Transmission Unit) size of the currently active interfaces. ifconfig is thus useful for debugging or performing system tuning.
Here is an example to display the status of all active network interfaces.
$ ifconfig

enp1s0    Link encap:Ethernet  HWaddr 28:d2:44:eb:bd:98
          inet addr:192.168.0.103  Bcast:192.168.0.255  Mask:255.255.255.0
          inet6 addr: fe80::8f0c:7825:8057:5eec/64 Scope:Link
          UP BROADCAST RUNNING MULTICAST  MTU:1500  Metric:1
          RX packets:169854 errors:0 dropped:0 overruns:0 frame:0
          TX packets:125995 errors:0 dropped:0 overruns:0 carrier:0
          collisions:0 txqueuelen:1000
          RX bytes:174146270 (174.1 MB)  TX bytes:21062129 (21.0 MB)

lo        Link encap:Local Loopback
          inet addr:127.0.0.1  Mask:255.0.0.0
          inet6 addr: ::1/128 Scope:Host
          UP LOOPBACK RUNNING  MTU:65536  Metric:1
          RX packets:15793 errors:0 dropped:0 overruns:0 frame:0
          TX packets:15793 errors:0 dropped:0 overruns:0 carrier:0
          collisions:0 txqueuelen:1
          RX bytes:2898946 (2.8 MB)  TX bytes:2898946 (2.8 MB)
To list all interfaces which are currently available, whether up or down, use the -a flag.
$ ifconfig -a
To assign an IP address to an interface, use the following command.
$ sudo ifconfig eth0 192.168.56.5 netmask 255.255.255.0
To activate a network interface, type.
$ sudo ifconfig up eth0
To deactivate or shut down a network interface, type.
$ sudo ifconfig down eth0
Note: Although ifconfig is a great tool, it is now obsolete (deprecated), its replacement is the ip command which is explained below.
2. IP Command
ip command is another useful command-line utility for displaying and manipulating routing, network devices, interfaces. It is a replacement for ifconfig and many other networking commands. (Read our article “What’s Difference Between ifconfig and ip Command” to learn more about it.)
The following command will show the IP address and other information about a network interface.
$ ip addr show

1: lo: <LOOPBACK,UP,LOWER_UP> mtu 65536 qdisc noqueue state UNKNOWN group default qlen 1
    link/loopback 00:00:00:00:00:00 brd 00:00:00:00:00:00
    inet 127.0.0.1/8 scope host lo
       valid_lft forever preferred_lft forever
    inet6 ::1/128 scope host
       valid_lft forever preferred_lft forever
2: enp1s0: <BROADCAST,MULTICAST,UP,LOWER_UP> mtu 1500 qdisc pfifo_fast state UP group default qlen 1000
    link/ether 28:d2:44:eb:bd:98 brd ff:ff:ff:ff:ff:ff
    inet 192.168.0.103/24 brd 192.168.0.255 scope global dynamic enp1s0
       valid_lft 5772sec preferred_lft 5772sec
    inet6 fe80::8f0c:7825:8057:5eec/64 scope link
       valid_lft forever preferred_lft forever
3: wlp2s0: <BROADCAST,MULTICAST> mtu 1500 qdisc noop state DOWN group default qlen 1000
    link/ether 38:b1:db:7c:78:c7 brd ff:ff:ff:ff:ff:ff
...
To temporarily assign IP Address to a specific network interface (eth0), type.
$ sudo ip addr add 192.168.56.1 dev eth0
To remove an assigned IP address from a network interface (eth0), type.
$ sudo ip addr del 192.168.56.15/24 dev eth0
To show the current neighbor table in the kernel, type.
$ ip neigh

192.168.0.1 dev enp1s0 lladdr 10:fe:ed:3d:f3:82 REACHABLE
3. ifup, ifdown, and ifquery command
ifup command actives a network interface, making it available to transfer and receive data.
$ sudo ifup eth0
ifdown command disables a network interface, keeping it in a state where it cannot transfer or receive data.
$ sudo ifdown eth0
ifquery command used to parse the network interface configuration, enabling you to receive answers to query about how it is currently configured.
$ sudo ifquery eth0
4. Ethtool Command
ethtool is a command-line utility for querying and modifying network interface controller parameters and device drivers. The example below shows the usage of ethtool and a command to view the parameters for the network interface.
$ sudo ethtool enp0s3

Settings for enp0s3:
	Supported ports: [ TP ]
	Supported link modes:   10baseT/Half 10baseT/Full
	                        100baseT/Half 100baseT/Full
	                        1000baseT/Full
	Supported pause frame use: No
	Supports auto-negotiation: Yes
	Advertised link modes:  10baseT/Half 10baseT/Full
	                        100baseT/Half 100baseT/Full
	                        1000baseT/Full
	Advertised pause frame use: No
	Advertised auto-negotiation: Yes
	Speed: 1000Mb/s
	Duplex: Full
	Port: Twisted Pair
	PHYAD: 0
	Transceiver: internal
	Auto-negotiation: on
	MDI-X: off (auto)
	Supports Wake-on: umbg
	Wake-on: d
	Current message level: 0x00000007 (7)
			       drv probe link
	Link detected: yes
5. Ping Command
ping (Packet INternet Groper) is a utility normally used for testing connectivity between two systems on a network (Local Area Network (LAN) or Wide Area Network (WAN)). It uses ICMP (Internet Control Message Protocol) to communicate to nodes on a network.
To test connectivity to another node, simply provide its IP or hostname, for example.
$ ping 192.168.0.103

PING 192.168.0.103 (192.168.0.103) 56(84) bytes of data.
64 bytes from 192.168.0.103: icmp_seq=1 ttl=64 time=0.191 ms
64 bytes from 192.168.0.103: icmp_seq=2 ttl=64 time=0.156 ms
64 bytes from 192.168.0.103: icmp_seq=3 ttl=64 time=0.179 ms
64 bytes from 192.168.0.103: icmp_seq=4 ttl=64 time=0.182 ms
64 bytes from 192.168.0.103: icmp_seq=5 ttl=64 time=0.207 ms
64 bytes from 192.168.0.103: icmp_seq=6 ttl=64 time=0.157 ms
^C
--- 192.168.0.103 ping statistics ---
6 packets transmitted, 6 received, 0% packet loss, time 5099ms
rtt min/avg/max/mdev = 0.156/0.178/0.207/0.023 ms
You can also tell ping to exit after a specified number of ECHO_REQUEST packets, using the -c flag as shown.
$ ping -c 4 192.168.0.103

PING 192.168.0.103 (192.168.0.103) 56(84) bytes of data.
64 bytes from 192.168.0.103: icmp_seq=1 ttl=64 time=1.09 ms
64 bytes from 192.168.0.103: icmp_seq=2 ttl=64 time=0.157 ms
64 bytes from 192.168.0.103: icmp_seq=3 ttl=64 time=0.163 ms
64 bytes from 192.168.0.103: icmp_seq=4 ttl=64 time=0.190 ms

--- 192.168.0.103 ping statistics ---
4 packets transmitted, 4 received, 0% packet loss, time 3029ms
rtt min/avg/max/mdev = 0.157/0.402/1.098/0.402 ms
6. Traceroute Command
Traceroute is a command-line utility for tracing the full path from your local system to another network system. It prints a number of hops (router IPs) in that path you travel to reach the end server. It is an easy-to-use network troubleshooting utility after the ping command.
In this example, we are tracing the route packets take from the local system to one of Google’s servers with IP address 216.58.204.46.
$ traceroute 216.58.204.46

traceroute to 216.58.204.46 (216.58.204.46), 30 hops max, 60 byte packets
 1  gateway (192.168.0.1)  0.487 ms  0.277 ms  0.269 ms
 2  5.5.5.215 (5.5.5.215)  1.846 ms  1.631 ms  1.553 ms
 3  * * *
 4  72.14.194.226 (72.14.194.226)  3.762 ms  3.683 ms  3.577 ms
 5  108.170.248.179 (108.170.248.179)  4.666 ms 108.170.248.162 (108.170.248.162)  4.869 ms 108.170.248.194 (108.170.248.194)  4.245 ms
 6  72.14.235.133 (72.14.235.133)  72.443 ms 209.85.241.175 (209.85.241.175)  62.738 ms 72.14.235.133 (72.14.235.133)  65.809 ms
 7  66.249.94.140 (66.249.94.140)  128.726 ms  127.506 ms 209.85.248.5 (209.85.248.5)  127.330 ms
 8  74.125.251.181 (74.125.251.181)  127.219 ms 108.170.236.124 (108.170.236.124)  212.544 ms 74.125.251.181 (74.125.251.181)  127.249 ms
 9  216.239.49.134 (216.239.49.134)  236.906 ms 209.85.242.80 (209.85.242.80)  254.810 ms  254.735 ms
10  209.85.251.138 (209.85.251.138)  252.002 ms 216.239.43.227 (216.239.43.227)  251.975 ms 209.85.242.80 (209.85.242.80)  236.343 ms
11  216.239.43.227 (216.239.43.227)  251.452 ms 72.14.234.8 (72.14.234.8)  279.650 ms  277.492 ms
12  209.85.250.9 (209.85.250.9)  274.521 ms  274.450 ms 209.85.253.249 (209.85.253.249)  270.558 ms
13  209.85.250.9 (209.85.250.9)  269.147 ms 209.85.254.244 (209.85.254.244)  347.046 ms 209.85.250.9 (209.85.250.9)  285.265 ms
14  64.233.175.112 (64.233.175.112)  344.852 ms 216.239.57.236 (216.239.57.236)  343.786 ms 64.233.175.112 (64.233.175.112)  345.273 ms
15  108.170.246.129 (108.170.246.129)  345.054 ms  345.342 ms 64.233.175.112 (64.233.175.112)  343.706 ms
16  108.170.238.119 (108.170.238.119)  345.610 ms 108.170.246.161 (108.170.246.161)  344.726 ms 108.170.238.117 (108.170.238.117)  345.536 ms
17  lhr25s12-in-f46.1e100.net (216.58.204.46)  345.382 ms  345.031 ms  344.884 ms
7. MTR Network Diagnostic Tool
MTR is a modern command-line network diagnostic tool that combines the functionality of ping and traceroute into a single diagnostic tool. Its output is updated in real-time, by default until you exit the program by pressing q.
The easiest way of running mtr is to provide it a hostname or IP address as an argument, as follows.
$ mtr google.com
OR
$ mtr 216.58.223.78
Sample Output
tecmint.com (0.0.0.0)                                   Thu Jul 12 08:58:27 2018
First TTL: 1

 Host                                                   Loss%   Snt   Last   Avg  Best  Wrst StDev
 1. 192.168.0.1                                         0.0%    41    0.5   0.6   0.4   1.7   0.2
 2. 5.5.5.215                                           0.0%    40    1.9   1.5   0.8   7.3   1.0
 3. 209.snat-111-91-120.hns.net.in                      23.1%    40    1.9   2.7   1.7  10.5   1.6
 4. 72.14.194.226                                       0.0%    40   89.1   5.2   2.2  89.1  13.7
 5. 108.170.248.193                                     0.0%    40    3.0   4.1   2.4  52.4   7.8
 6. 108.170.237.43                                      0.0%    40    2.9   5.3   2.5  94.1  14.4
 7. bom07s10-in-f174.1e100.net                          0.0%    40    2.6   6.7   2.3  79.7  16.
You can limit the number of pings to a specific value and exit mtr after those pings, using the -c flag as shown.
$ mtr -c 4 google.com
8. Route Command
The route is a command-line utility for displaying or manipulating the IP routing table of a Linux system. It is mainly used to configure static routes to specific hosts or networks via an interface.
You can view the Kernel IP routing table by typing.
$ route

Destination     Gateway         Genmask         Flags Metric Ref    Use Iface
default         gateway         0.0.0.0         UG    100    0        0 enp0s3
192.168.0.0     0.0.0.0         255.255.255.0   U     100    0        0 enp0s3
192.168.122.0   0.0.0.0         255.255.255.0   U     0      0        0 virbr0
There are numerous commands you can use to configure routing. Here are some useful ones:
Add a default gateway to the routing table.
$ sudo route add default gw <gateway-ip>
Add a network route to the routing table.
$ sudo route add -net <network ip/cidr> gw <gateway ip> <interface>
Delete a specific route entry from the routing table.
$ sudo route del -net <network ip/cidr>
9. Nmcli Command
Nmcli is an easy-to-use, scriptable command-line tool to report network status, manage network connections, and control the NetworkManager.
To view all your network devices, type.
$ nmcli dev status

DEVICE      TYPE      STATE      CONNECTION
virbr0      bridge    connected  virbr0
enp0s3      ethernet  connected  Wired connection 1
To check network connections on your system, type.
$ nmcli con show

Wired connection 1  bc3638ff-205a-3bbb-8845-5a4b0f7eef91  802-3-ethernet  enp0s3
virbr0              00f5d53e-fd51-41d3-b069-bdfd2dde062b  bridge          virbr0
To see only the active connections, add the -a flag.
$ nmcli con show -a
Network Scanning and Performance Analysis Tools
10. Netstat Command
netstat is a command-line tool that displays useful information such as network connections, routing tables, interface statistics, and much more, concerning the Linux networking subsystem. It is useful for network troubleshooting and performance analysis.
Additionally, it is also a fundamental network service debugging tool used to check which programs are listening on what ports. For instance, the following command will show all TCP ports in listening mode and what programs are listening on them.
$ sudo netstat -tnlp

Active Internet connections (only servers)
Proto Recv-Q Send-Q Local Address           Foreign Address         State       PID/Program name
tcp        0      0 0.0.0.0:587             0.0.0.0:*               LISTEN      1257/master
tcp        0      0 127.0.0.1:5003          0.0.0.0:*               LISTEN      1/systemd
tcp        0      0 0.0.0.0:110             0.0.0.0:*               LISTEN      1015/dovecot
tcp        0      0 0.0.0.0:143             0.0.0.0:*               LISTEN      1015/dovecot
tcp        0      0 0.0.0.0:111             0.0.0.0:*               LISTEN      1/systemd
tcp        0      0 0.0.0.0:465             0.0.0.0:*               LISTEN      1257/master
tcp        0      0 0.0.0.0:53              0.0.0.0:*               LISTEN      1404/pdns_server
tcp        0      0 0.0.0.0:21              0.0.0.0:*               LISTEN      1064/pure-ftpd (SER
tcp        0      0 0.0.0.0:22              0.0.0.0:*               LISTEN      972/sshd
tcp        0      0 127.0.0.1:631           0.0.0.0:*               LISTEN      975/cupsd
tcp        0      0 0.0.0.0:25              0.0.0.0:*               LISTEN      1257/master
tcp        0      0 0.0.0.0:8090            0.0.0.0:*               LISTEN      636/lscpd (lscpd -
tcp        0      0 0.0.0.0:993             0.0.0.0:*               LISTEN      1015/dovecot
tcp        0      0 0.0.0.0:995             0.0.0.0:*               LISTEN      1015/dovecot
tcp6       0      0 :::3306                 :::*                    LISTEN      1053/mysqld
tcp6       0      0 :::3307                 :::*                    LISTEN      1211/mysqld
tcp6       0      0 :::587                  :::*                    LISTEN      1257/master
tcp6       0      0 :::110                  :::*                    LISTEN      1015/dovecot
tcp6       0      0 :::143                  :::*                    LISTEN      1015/dovecot
tcp6       0      0 :::111                  :::*                    LISTEN      1/systemd
tcp6       0      0 :::80                   :::*                    LISTEN      990/httpd
tcp6       0      0 :::465                  :::*                    LISTEN      1257/master
tcp6       0      0 :::53                   :::*                    LISTEN      1404/pdns_server
tcp6       0      0 :::21                   :::*                    LISTEN      1064/pure-ftpd (SER
tcp6       0      0 :::22                   :::*                    LISTEN      972/sshd
tcp6       0      0 ::1:631                 :::*                    LISTEN      975/cupsd
tcp6       0      0 :::25                   :::*                    LISTEN      1257/master
tcp6       0      0 :::993                  :::*                    LISTEN      1015/dovecot
tcp6       0      0 :::995                  :::*                    LISTEN      1015/dovecot
To view the kernel routing table, use the -r flag (which is equivalent to running the route command above).
$ netstat -r

Destination     Gateway         Genmask         Flags   MSS Window  irtt Iface
default         gateway         0.0.0.0         UG        0 0          0 enp0s3
192.168.0.0     0.0.0.0         255.255.255.0   U         0 0          0 enp0s3
192.168.122.0   0.0.0.0         255.255.255.0   U         0 0          0 virbr0
Note: Although Netstat is a great tool, it is now obsolete (deprecated), its replacement is the ss command which is explained below.
11. ss Command
ss (socket statistics) is a powerful command-line utility to investigate sockets. It dumps socket statistics and displays information similar to netstat. In addition, it shows more TCP and state information compared to other similar utilities.
The following example shows how to list all TCP ports (sockets) that are open on a server.
$ ss -ta

State      Recv-Q Send-Q                                        Local Address:Port                                                         Peer Address:Port
LISTEN     0      100                                                       *:submission                                                              *:*
LISTEN     0      128                                               127.0.0.1:fmpro-internal                                                          *:*
LISTEN     0      100                                                       *:pop3                                                                    *:*
LISTEN     0      100                                                       *:imap                                                                    *:*
LISTEN     0      128                                                       *:sunrpc                                                                  *:*
LISTEN     0      100                                                       *:urd                                                                     *:*
LISTEN     0      128                                                       *:domain                                                                  *:*
LISTEN     0      9                                                         *:ftp                                                                     *:*
LISTEN     0      128                                                       *:ssh                                                                     *:*
LISTEN     0      128                                               127.0.0.1:ipp                                                                     *:*
LISTEN     0      100                                                       *:smtp                                                                    *:*
LISTEN     0      128                                                       *:8090                                                                    *:*
LISTEN     0      100                                                       *:imaps                                                                   *:*
LISTEN     0      100                                                       *:pop3s                                                                   *:*
ESTAB      0      0                                             192.168.0.104:ssh                                                         192.168.0.103:36398
ESTAB      0      0                                                 127.0.0.1:34642                                                           127.0.0.1:opsession-prxy
ESTAB      0      0                                                 127.0.0.1:34638                                                           127.0.0.1:opsession-prxy
ESTAB      0      0                                                 127.0.0.1:34644                                                           127.0.0.1:opsession-prxy
ESTAB      0      0                                                 127.0.0.1:34640                                                           127.0.0.1:opsession-prxy
LISTEN     0      80                                                       :::mysql                                                                  :::*
...
To display all active TCP connections together with their timers, run the following command.
$ ss -to
12. NC Command
NC (NetCat) also referred to as the “Network Swiss Army knife”, is a powerful utility used for almost any task related to TCP, UDP, or UNIX-domain sockets. It is used to open TCP connections, listen on arbitrary TCP and UDP ports, perform port scanning plus more.
You can also use it as a simple TCP proxy, for network daemon testing, to check if remote ports are reachable, and much more. Furthermore, you can employ nc together with pv command to transfer files between two computers.
[ You might also like: 8 Netcat (nc) Command with Examples ]
The following example will show how to scan a list of ports.
$ nc -zv server2.tecmint.lan 21 22 80 443 3000
You can also specify a range of ports as shown.
$ nc -zv server2.tecmint.lan 20-90
The following example shows how to use nc to open a TCP connection to port 5000 on server2.tecmint.lan, using port 3000 as the source port, with a timeout of 10 seconds.
$ nc -p 3000 -w 10 server2.tecmint.lan 5000
13. Nmap Command
Nmap (Network Mapper) is a powerful and extremely versatile tool for Linux system/network administrators. It is used to gather information about a single host or explores networks an entire network. Nmap is also used to perform security scans, network audits and finding open ports on remote hosts and so much more.
You can scan a host using its hostname or IP address, for instance.
$ nmap google.com

Starting Nmap 6.40 ( http://nmap.org ) at 2018-07-12 09:23 BST
Nmap scan report for google.com (172.217.166.78)
Host is up (0.0036s latency).
rDNS record for 172.217.166.78: bom05s15-in-f14.1e100.net
Not shown: 998 filtered ports
PORT    STATE SERVICE
80/tcp  open  http
443/tcp open  https

Nmap done: 1 IP address (1 host up) scanned in 4.92 seconds
Alternatively, use an IP address as shown.
$ nmap 192.168.0.103

Starting Nmap 6.40 ( http://nmap.org ) at 2018-07-12 09:24 BST
Nmap scan report for 192.168.0.103
Host is up (0.000051s latency).
Not shown: 994 closed ports
PORT     STATE SERVICE
22/tcp   open  ssh
25/tcp   open  smtp
902/tcp  open  iss-realsecure
4242/tcp open  vrml-multi-use
5900/tcp open  vnc
8080/tcp open  http-proxy
MAC Address: 28:D2:44:EB:BD:98 (Lcfc(hefei) Electronics Technology Co.)

Nmap done: 1 IP address (1 host up) scanned in 0.13 seconds
Read our following useful articles on the nmap command.
DNS Lookup Utilities
14. host Command
host command is a simple utility for carrying out DNS lookups, it translates hostnames to IP addresses and vice versa.
$ host google.com

google.com has address 172.217.166.78
google.com mail is handled by 20 alt1.aspmx.l.google.com.
google.com mail is handled by 30 alt2.aspmx.l.google.com.
google.com mail is handled by 40 alt3.aspmx.l.google.com.
google.com mail is handled by 50 alt4.aspmx.l.google.com.
google.com mail is handled by 10 aspmx.l.google.com.
15. dig Command
dig (domain information groper) is also another simple DNS lookup utility, that is used to query DNS related information such as A Record, CNAME, MX Record etc, for example:
$ dig google.com

; <<>> DiG 9.9.4-RedHat-9.9.4-51.el7 <<>> google.com
;; global options: +cmd
;; Got answer:
;; ->>HEADER<<- opcode: QUERY, status: NOERROR, id: 23083
;; flags: qr rd ra; QUERY: 1, ANSWER: 1, AUTHORITY: 13, ADDITIONAL: 14

;; OPT PSEUDOSECTION:
; EDNS: version: 0, flags:; udp: 4096
;; QUESTION SECTION:
;google.com.			IN	A

;; ANSWER SECTION:
google.com.		72	IN	A	172.217.166.78

;; AUTHORITY SECTION:
com.			13482	IN	NS	c.gtld-servers.net.
com.			13482	IN	NS	d.gtld-servers.net.
com.			13482	IN	NS	e.gtld-servers.net.
com.			13482	IN	NS	f.gtld-servers.net.
com.			13482	IN	NS	g.gtld-servers.net.
com.			13482	IN	NS	h.gtld-servers.net.
com.			13482	IN	NS	i.gtld-servers.net.
com.			13482	IN	NS	j.gtld-servers.net.
com.			13482	IN	NS	k.gtld-servers.net.
com.			13482	IN	NS	l.gtld-servers.net.
com.			13482	IN	NS	m.gtld-servers.net.
com.			13482	IN	NS	a.gtld-servers.net.
com.			13482	IN	NS	b.gtld-servers.net.

;; ADDITIONAL SECTION:
a.gtld-servers.net.	81883	IN	A	192.5.6.30
b.gtld-servers.net.	3999	IN	A	192.33.14.30
c.gtld-servers.net.	14876	IN	A	192.26.92.30
d.gtld-servers.net.	85172	IN	A	192.31.80.30
e.gtld-servers.net.	95861	IN	A	192.12.94.30
f.gtld-servers.net.	78471	IN	A	192.35.51.30
g.gtld-servers.net.	5217	IN	A	192.42.93.30
h.gtld-servers.net.	111531	IN	A	192.54.112.30
i.gtld-servers.net.	93017	IN	A	192.43.172.30
j.gtld-servers.net.	93542	IN	A	192.48.79.30
k.gtld-servers.net.	107218	IN	A	192.52.178.30
l.gtld-servers.net.	6280	IN	A	192.41.162.30
m.gtld-servers.net.	2689	IN	A	192.55.83.30

;; Query time: 4 msec
;; SERVER: 192.168.0.1#53(192.168.0.1)
;; WHEN: Thu Jul 12 09:30:57 BST 2018
;; MSG SIZE  rcvd: 487
16. NSLookup Command
Nslookup is also a popular command-line utility to query DNS servers both interactively and non-interactively. It is used to query DNS resource records (RR). You can find out the “A” record (IP address) of a domain as shown.
$ nslookup google.com

Server:		192.168.0.1
Address:	192.168.0.1#53

Non-authoritative answer:
Name:	google.com
Address: 172.217.166.78
You can also perform a reverse domain lookup as shown.
$ nslookup 216.58.208.174

Server:		192.168.0.1
Address:	192.168.0.1#53

Non-authoritative answer:
174.208.58.216.in-addr.arpa	name = lhr25s09-in-f14.1e100.net.
174.208.58.216.in-addr.arpa	name = lhr25s09-in-f174.1e100.net.

Authoritative answers can be found from:
in-addr.arpa	nameserver = e.in-addr-servers.arpa.
in-addr.arpa	nameserver = f.in-addr-servers.arpa.
in-addr.arpa	nameserver = a.in-addr-servers.arpa.
in-addr.arpa	nameserver = b.in-addr-servers.arpa.
in-addr.arpa	nameserver = c.in-addr-servers.arpa.
in-addr.arpa	nameserver = d.in-addr-servers.arpa.
a.in-addr-servers.arpa	internet address = 199.180.182.53
b.in-addr-servers.arpa	internet address = 199.253.183.183
c.in-addr-servers.arpa	internet address = 196.216.169.10
d.in-addr-servers.arpa	internet address = 200.10.60.53
e.in-addr-servers.arpa	internet address = 203.119.86.101
f.in-addr-servers.arpa	internet address = 193.0.9.1
Linux Network Packet Analyzers
17. Tcpdump Command
Tcpdump is a very powerful and widely used command-line network sniffer. It is used to capture and analyze TCP/IP packets transmitted or received over a network on a specific interface.
To capture packets from a given interface, specify it using the -i option.
$ tcpdump -i eth1

tcpdump: verbose output suppressed, use -v or -vv for full protocol decode
listening on enp0s3, link-type EN10MB (Ethernet), capture size 262144 bytes
09:35:40.287439 IP tecmint.com.ssh > 192.168.0.103.36398: Flags [P.], seq 4152360356:4152360552, ack 306922699, win 270, options [nop,nop,TS val 2211778668 ecr 2019055], length 196
09:35:40.287655 IP 192.168.0.103.36398 > tecmint.com.ssh: Flags [.], ack 196, win 5202, options [nop,nop,TS val 2019058 ecr 2211778668], length 0
09:35:40.288269 IP tecmint.com.54899 > gateway.domain: 43760+ PTR? 103.0.168.192.in-addr.arpa. (44)
09:35:40.333763 IP gateway.domain > tecmint.com.54899: 43760 NXDomain* 0/1/0 (94)
09:35:40.335311 IP tecmint.com.52036 > gateway.domain: 44289+ PTR? 1.0.168.192.in-addr.arpa. (42)
To capture a specific number of packets, use the -c option to enter the desired number.
$ tcpdump -c 5 -i eth1
You can also capture and save packets to a file for later analysis, use the -w flag to specify the output file.
$ tcpdump -w captured.pacs -i eth1
18. Wireshark Utility
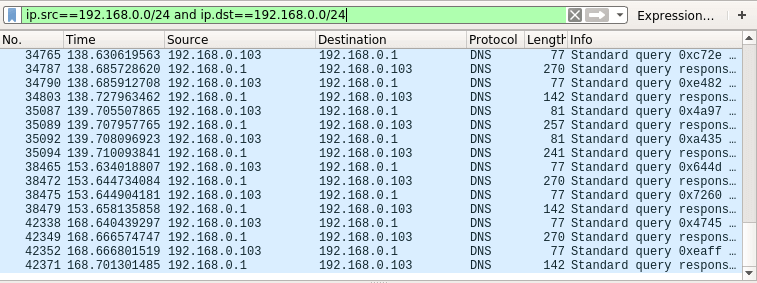
Wireshark is a popular, powerful, versatile, and easy-to-use tool for capturing and analyzing packets in a packet-switched network, in real-time.
You can also save data it has captured to a file for later inspection. It is used by system administrators and network engineers to monitor and inspect the packets for security and troubleshooting purposes.
19. Bmon Tool
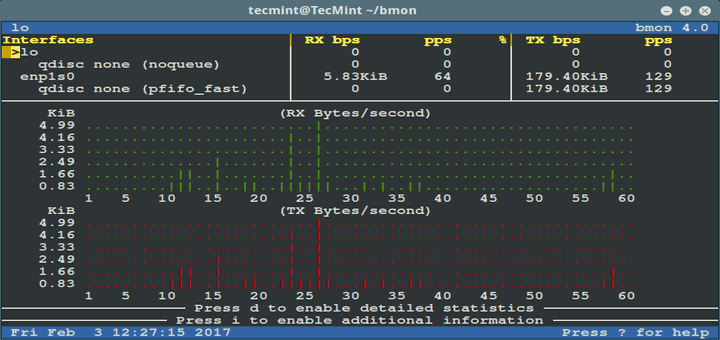
bmon is a powerful, command line-based network monitoring and debugging utility for Unix-like systems, it captures networking-related statistics and prints them visually in a human-friendly format. It is a reliable and effective real-time bandwidth monitor and rate estimator.
Linux Firewall Management Tools
20. Iptables Firewall
iptables is a command-line tool for configuring, maintaining, and inspecting the tables IP packet filtering and NAT ruleset. It is used to set up and manage the Linux firewall (Netfilter). It allows you to list existing packet filter rules; add or delete or modify packet filter rules; list per-rule counters of the packet filter rules.
You can learn how to use Iptables for various purposes from our simple yet comprehensive guides.
21. Firewalld
Firewalld is a powerful and dynamic daemon to manage the Linux firewall (Netfilter), just like iptables. It uses “networks zones” instead of INPUT, OUTPUT, and FORWARD CHAINS in iptables. On current Linux distributions such as RHEL/CentOS 7 and Fedora 21+, iptables is actively being replaced by firewalld.
To get started with firewalld, consult these guides listed below:
Important: Iptables is still supported and can be installed with the YUM package manager. However, you can’t use Firewalld and iptables at the same time on the same server – you must choose one.
22. UFW (Uncomplicated Firewall)
UFW is a well-known and default firewall configuration tool on Debian and Ubuntu Linux distributions. It is used to enable/disable system firewall, add/delete/modify/reset packet filtering rules, and much more.
To check UFW firewall status, type.
$ sudo ufw status
If the UFW firewall is not active, you can activate or enable it using the following command.
$ sudo ufw enable
To disable the UFW firewall, use the following command.
$ sudo ufw disable
Read our article How to Setup UFW Firewall on Ubuntu and Debian.
If you want to find more information about a particular program, you can consult its man pages as shown.
$ man programs_name
That’s all for now! In this comprehensive guide, we reviewed some of the most used command-line tools and utilities for network management in Linux, under different categories, for system administrators, and equally useful to full-time network administrators/engineers.
You can share your thoughts about this guide via the comment form below. If we have missed any frequently used and important Linux networking tools/utilities or any useful related information, also let us know.
Previous article:
Next article:
Each tutorial at TecMint is created by a team of experienced Linux system administrators so that it meets our high-quality standards.




Very good tutorial and very good site with good tutorials.
About `ifconfig` you mentioned.
> Note: Although ifconfig is a great tool, it is now obsolete (deprecated), its replacement is IP command which is explained below.
Maybe it would be better to remove the ifconfig section? Because an old-time Linux user would probably know well about ifconfig anyway. Or if you think it is still useful to document about ifconfig, place the section AFTER `ip address` command + add the deprecation warning right before you begin to explain about ifconfig?
@Tristan
Okay, thanks for writing back, we will remove the ifconfig section.
Then maybe this would make sense to do the same for the netstat section. You said in the article “Note: Although Netstat is a great tool, it is now obsolete (deprecated), its replacement is ss command which is explained below”. And maybe add a small sentence saying that ifconfig and netstate are deprecated and give link to your past articles on those commands.
@Tristan
Oh yes, we are in the process of updating the article. We will identify all tools that need to be removed from here. Thanks for the useful feedback once again.
Thank you so much for this. I like how it is concise.
Thank for a nice and informative article. I had forgotten some of the networking tools so, now I have refreshed.
@Emanuel
We are glad that you find this article useful. Many thanks for writing back.
Thanks for this article. I’m not the best when it comes to networking so I’m doing my part by self education.
@Sam
You are most welcome, and many thanks for the useful feedback.