Memory management in terms of monitoring memory usage is one important thing to do on your Linux system, there are many tools available for monitoring your memory usage that you can find on different Linux distributions. But they work in different ways, in this how to guide, we shall take a look at how to install and use one such tool called smem.
Don’t Miss: 20 Command Line Tools to Monitor Linux Performance
Smem is a command-line memory reporting tool thats gives a user diverse reports on memory usage on a Linux system. There is one unique thing about smem, unlike other traditional memory reporting tools, it reports PSS (Proportional Set Size), a more meaningful representation of memory usage by applications and libraries in a virtual memory setup.
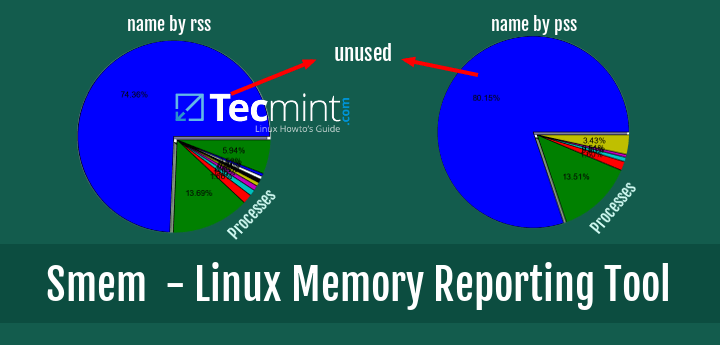
Existing traditional tools focus mainly on reading RSS (Resident Set Size) which is a standard measure to monitor memory usage in a physical memory scheme, but tends to overestimate memory usage by applications.
PSS on the other hand, gives a reasonable measure by determining the “fair-share” of memory used by applications and libraries in a virtual memory scheme.
You can read this guide (about memory RSS and PSS) to understand memory consumption in a Linux system, but let us proceed to looking at some of the features of smem.
Features of Smem Tool
- System overview listing
- Listings and also filtering by process, mappings or user
- Using data from /proc filesystem
- Configurable listing columns from several data sources
- Configurable output units and percentages
- Easy to configure headers and totals in listings
- Using data snapshots from directory mirrors or compressed tar files
- Built-in chart generation mechanism
- Lightweight capture tool used in embedded systems
How to Install Smem – Memory Reporting Tool in Linux
Before you proceed with installation of smem, your system must meet the following requirements:
- modern kernel (> 2.6.27 or so)
- a recent version of Python (2.4 or so)
- optional matplotlib library for generation of charts
Most of the today’s Linux distributions comes with latest Kernel version with Python 2 or 3 support, so the only requirement is to install matplotlib library which is used to generate nice charts.
On RHEL, CentOS and Fedora
First enable EPEL (Extra Packages for Enterprise Linux) repository and then install as follows:
# yum install smem python-matplotlib python-tk
On Debian and Ubuntu
$ sudo apt-get install smem
On Linux Mint
$ sudo apt-get install smem python-matplotlib python-tk
on Arch Linux
Use this AUR repository.
How to Use Smem – Memory Reporting Tool in Linux
To view a report of memory usage across the whole system, by all system users, run the following command:
$ sudo smem
 PID User     Command                         Swap      USS      PSS      RSS
 6367 tecmint  cat                                0      100      145     1784
 6368 tecmint  cat                                0      100      147     1676
 2864 tecmint  /usr/bin/ck-launch-session         0      144      165     1780
 7656 tecmint  gnome-pty-helper                   0      156      178     1832
 5758 tecmint  gnome-pty-helper                   0      156      179     1916
 1441 root     /sbin/getty -8 38400 tty2          0      152      184     2052
 1434 root     /sbin/getty -8 38400 tty5          0      156      187     2060
 1444 root     /sbin/getty -8 38400 tty3          0      156      187     2060
 1432 root     /sbin/getty -8 38400 tty4          0      156      188     2124
 1452 root     /sbin/getty -8 38400 tty6          0      164      196     2064
 2619 root     /sbin/getty -8 38400 tty1          0      164      196     2136
 3544 tecmint  sh -c /usr/lib/linuxmint/mi        0      212      224     1540
 1504 root     acpid -c /etc/acpi/events -        0      220      236     1604
 3311 tecmint  syndaemon -i 0.5 -K -R             0      252      292     2556
 3143 rtkit    /usr/lib/rtkit/rtkit-daemon        0      300      326     2548
 1588 root     cron                               0      292      333     2344
 1589 avahi    avahi-daemon: chroot helpe         0      124      334     1632
 1523 root     /usr/sbin/irqbalance               0      316      343     2096
  585 root     upstart-socket-bridge --dae        0      328      351     1820
 3033 tecmint  /usr/bin/dbus-launch --exit        0      328      360     2160
 1346 root     upstart-file-bridge --daemo        0      348      371     1776
 2607 root     /usr/bin/xdm                       0      188      378     2368
 1635 kernoops /usr/sbin/kerneloops               0      352      386     2684
  344 root     upstart-udev-bridge --daemo        0      400      427     2132
 2960 tecmint  /usr/bin/ssh-agent /usr/bin        0      480      485      992
 3468 tecmint  /bin/dbus-daemon --config-f        0      344      515     3284
 1559 avahi    avahi-daemon: running [tecm        0      284      517     3108
 7289 postfix  pickup -l -t unix -u -c            0      288      534     2808
 2135 root     /usr/lib/postfix/master            0      352      576     2872
 2436 postfix  qmgr -l -t unix -u                 0      360      606     2884
 1521 root     /lib/systemd/systemd-logind        0      600      650     3276
 2222 nobody   /usr/sbin/dnsmasq --no-reso        0      604      669     3288
....
When a normal user runs smem, it displays memory usage by process that the user has started, the processes are arranged in order of increasing PSS.
Take a look at the output below on my system for memory usage by processes started by user aaronkilik:
$ smem
 PID User     Command                         Swap      USS      PSS      RSS
 6367 tecmint  cat                                0      100      145     1784
 6368 tecmint  cat                                0      100      147     1676
 2864 tecmint  /usr/bin/ck-launch-session         0      144      166     1780
 3544 tecmint  sh -c /usr/lib/linuxmint/mi        0      212      224     1540
 3311 tecmint  syndaemon -i 0.5 -K -R             0      252      292     2556
 3033 tecmint  /usr/bin/dbus-launch --exit        0      328      360     2160
 3468 tecmint  /bin/dbus-daemon --config-f        0      344      515     3284
 3122 tecmint  /usr/lib/gvfs/gvfsd                0      656      801     5552
 3471 tecmint  /usr/lib/at-spi2-core/at-sp        0      708      864     5992
 3396 tecmint  /usr/lib/gvfs/gvfs-mtp-volu        0      804      914     6204
 3208 tecmint  /usr/lib/x86_64-linux-gnu/i        0      892     1012     6188
 3380 tecmint  /usr/lib/gvfs/gvfs-afc-volu        0      820     1024     6396
 3034 tecmint  //bin/dbus-daemon --fork --        0      920     1081     3040
 3365 tecmint  /usr/lib/gvfs/gvfs-gphoto2-        0      972     1099     6052
 3228 tecmint  /usr/lib/gvfs/gvfsd-trash -        0      980     1153     6648
 3107 tecmint  /usr/lib/dconf/dconf-servic        0     1212     1283     5376
 6399 tecmint  /opt/google/chrome/chrome -        0      144     1409    10732
 3478 tecmint  /usr/lib/x86_64-linux-gnu/g        0     1724     1820     6320
 7365 tecmint  /usr/lib/gvfs/gvfsd-http --        0     1352     1884     8704
 6937 tecmint  /opt/libreoffice5.0/program        0     1140     2328     5040
 3194 tecmint  /usr/lib/x86_64-linux-gnu/p        0     1956     2405    14228
 6373 tecmint  /opt/google/chrome/nacl_hel        0     2324     2541     8908
 3313 tecmint  /usr/lib/gvfs/gvfs-udisks2-        0     2460     2754     8736
 3464 tecmint  /usr/lib/at-spi2-core/at-sp        0     2684     2823     7920
 5771 tecmint  ssh -p 4521 [email protected]        0     2544     2864     6540
 5759 tecmint  /bin/bash                          0     2416     2923     5640
 3541 tecmint  /usr/bin/python /usr/bin/mi        0     2584     3008     7248
 7657 tecmint  bash                               0     2516     3055     6028
 3127 tecmint  /usr/lib/gvfs/gvfsd-fuse /r        0     3024     3126     8032
 3205 tecmint  mate-screensaver                   0     2520     3331    18072
 3171 tecmint  /usr/lib/mate-panel/notific        0     2860     3495    17140
 3030 tecmint  x-session-manager                  0     4400     4879    17500
 3197 tecmint  mate-volume-control-applet         0     3860     5226    23736
...
There are many options to invoke while using smem, for example, to view system wide memory consumption, run the following command:
$ sudo smem -w
Area                           Used      Cache   Noncache
firmware/hardware                 0          0          0
kernel image                      0          0          0
kernel dynamic memory       1425320    1291412     133908
userspace memory            2215368     451608    1763760
free memory                 4424936    4424936          0
To view memory usage on a per-user basis, run the command below:
$ sudo smem -u
User     Count     Swap      USS      PSS      RSS
rtkit        1        0      300      326     2548
kernoops     1        0      352      385     2684
avahi        2        0      408      851     4740
postfix      2        0      648     1140     5692
messagebus     1        0     1012     1173     3320
syslog       1        0     1396     1419     3232
www-data     2        0     5100     6572    13580
mpd          1        0     7416     8302    12896
nobody       2        0     4024    11305    24728
root        39        0   323876   353418   496520
tecmint     64        0  1652888  1815699  2763112
You can also report memory usage by mappings as follows:
$ sudo smem -m
Map                                       PIDs   AVGPSS      PSS
/dev/fb0                                     1        0        0
/home/tecmint/.cache/fontconfig/7ef2298f    18        0        0
/home/tecmint/.cache/fontconfig/c57959a1    18        0        0
/home/tecmint/.local/share/mime/mime.cac    15        0        0
/opt/google/chrome/chrome_material_100_p     9        0        0
/opt/google/chrome/chrome_material_200_p     9        0        0
/usr/lib/x86_64-linux-gnu/gconv/gconv-mo    41        0        0
/usr/share/icons/Mint-X-Teal/icon-theme.    15        0        0
/var/cache/fontconfig/0c9eb80ebd1c36541e    20        0        0
/var/cache/fontconfig/0d8c3b2ac0904cb8a5    20        0        0
/var/cache/fontconfig/1ac9eb803944fde146    20        0        0
/var/cache/fontconfig/3830d5c3ddfd5cd38a    20        0        0
/var/cache/fontconfig/385c0604a188198f04    20        0        0
/var/cache/fontconfig/4794a0821666d79190    20        0        0
/var/cache/fontconfig/56cf4f4769d0f4abc8    20        0        0
/var/cache/fontconfig/767a8244fc0220cfb5    20        0        0
/var/cache/fontconfig/8801497958630a81b7    20        0        0
/var/cache/fontconfig/99e8ed0e538f840c56    20        0        0
/var/cache/fontconfig/b9d506c9ac06c20b43    20        0        0
/var/cache/fontconfig/c05880de57d1f5e948    20        0        0
/var/cache/fontconfig/dc05db6664285cc2f1    20        0        0
/var/cache/fontconfig/e13b20fdb08344e0e6    20        0        0
/var/cache/fontconfig/e7071f4a29fa870f43    20        0        0
....
There are also options for filtering smem output and we shall look at two examples here.
To filter output by username, invoke the -u or --userfilter="regex" option as below:
$ sudo smem -u
User     Count     Swap      USS      PSS      RSS
rtkit        1        0      300      326     2548
kernoops     1        0      352      385     2684
avahi        2        0      408      851     4740
postfix      2        0      648     1140     5692
messagebus     1        0     1012     1173     3320
syslog       1        0     1400     1423     3236
www-data     2        0     5100     6572    13580
mpd          1        0     7416     8302    12896
nobody       2        0     4024    11305    24728
root        39        0   323804   353374   496552
tecmint     64        0  1708900  1871766  2819212
To filter output by process name, invoke the -P or --processfilter="regex" option as follows:
$ sudo smem --processfilter="firefox"
PID User     Command                         Swap      USS      PSS      RSS
 9212 root     sudo smem --processfilter=f        0     1172     1434     4856
 9213 root     /usr/bin/python /usr/bin/sm        0     7368     7793    11984
 4424 tecmint  /usr/lib/firefox/firefox           0   931732   937590   961504
Output formatting can be very important, and there are options to help you format memory reports and we shall take a look at few examples below.
To show desired columns in the report, use -c or --columns option as follows:
$ sudo smem -c "name user pss rss"
Name                     User          PSS      RSS
cat                      tecmint       145     1784
cat                      tecmint       147     1676
ck-launch-sessi          tecmint       165     1780
gnome-pty-helpe          tecmint       178     1832
gnome-pty-helpe          tecmint       179     1916
getty                    root          184     2052
getty                    root          187     2060
getty                    root          187     2060
getty                    root          188     2124
getty                    root          196     2064
getty                    root          196     2136
sh                       tecmint       224     1540
acpid                    root          236     1604
syndaemon                tecmint       296     2560
rtkit-daemon             rtkit         326     2548
cron                     root          333     2344
avahi-daemon             avahi         334     1632
irqbalance               root          343     2096
upstart-socket-          root          351     1820
dbus-launch              tecmint       360     2160
upstart-file-br          root          371     1776
xdm                      root          378     2368
kerneloops               kernoops      386     2684
upstart-udev-br          root          427     2132
ssh-agent                tecmint       485      992
...
You can invoke the -p option to report memory usage in percentages, as in the command below:
$ sudo smem -p
 PID User     Command                         Swap      USS      PSS      RSS
 6367 tecmint  cat                            0.00%    0.00%    0.00%    0.02%
 6368 tecmint  cat                            0.00%    0.00%    0.00%    0.02%
 9307 tecmint  sh -c { sudo /usr/lib/linux    0.00%    0.00%    0.00%    0.02%
 2864 tecmint  /usr/bin/ck-launch-session     0.00%    0.00%    0.00%    0.02%
 3544 tecmint  sh -c /usr/lib/linuxmint/mi    0.00%    0.00%    0.00%    0.02%
 5758 tecmint  gnome-pty-helper               0.00%    0.00%    0.00%    0.02%
 7656 tecmint  gnome-pty-helper               0.00%    0.00%    0.00%    0.02%
 1441 root     /sbin/getty -8 38400 tty2      0.00%    0.00%    0.00%    0.03%
 1434 root     /sbin/getty -8 38400 tty5      0.00%    0.00%    0.00%    0.03%
 1444 root     /sbin/getty -8 38400 tty3      0.00%    0.00%    0.00%    0.03%
 1432 root     /sbin/getty -8 38400 tty4      0.00%    0.00%    0.00%    0.03%
 1452 root     /sbin/getty -8 38400 tty6      0.00%    0.00%    0.00%    0.03%
 2619 root     /sbin/getty -8 38400 tty1      0.00%    0.00%    0.00%    0.03%
 1504 root     acpid -c /etc/acpi/events -    0.00%    0.00%    0.00%    0.02%
 3311 tecmint  syndaemon -i 0.5 -K -R         0.00%    0.00%    0.00%    0.03%
 3143 rtkit    /usr/lib/rtkit/rtkit-daemon    0.00%    0.00%    0.00%    0.03%
 1588 root     cron                           0.00%    0.00%    0.00%    0.03%
 1589 avahi    avahi-daemon: chroot helpe     0.00%    0.00%    0.00%    0.02%
 1523 root     /usr/sbin/irqbalance           0.00%    0.00%    0.00%    0.03%
  585 root     upstart-socket-bridge --dae    0.00%    0.00%    0.00%    0.02%
 3033 tecmint  /usr/bin/dbus-launch --exit    0.00%    0.00%    0.00%    0.03%
....
The command below will show totals at the end of each column of the output:
$ sudo smem -t
PID User     Command                         Swap      USS      PSS      RSS
 6367 tecmint  cat                                0      100      139     1784
 6368 tecmint  cat                                0      100      141     1676
 9307 tecmint  sh -c { sudo /usr/lib/linux        0       96      158     1508
 2864 tecmint  /usr/bin/ck-launch-session         0      144      163     1780
 3544 tecmint  sh -c /usr/lib/linuxmint/mi        0      108      170     1540
 5758 tecmint  gnome-pty-helper                   0      156      176     1916
 7656 tecmint  gnome-pty-helper                   0      156      176     1832
 1441 root     /sbin/getty -8 38400 tty2          0      152      181     2052
 1434 root     /sbin/getty -8 38400 tty5          0      156      184     2060
 1444 root     /sbin/getty -8 38400 tty3          0      156      184     2060
 1432 root     /sbin/getty -8 38400 tty4          0      156      185     2124
 1452 root     /sbin/getty -8 38400 tty6          0      164      193     2064
 2619 root     /sbin/getty -8 38400 tty1          0      164      193     2136
 1504 root     acpid -c /etc/acpi/events -        0      220      232     1604
 3311 tecmint  syndaemon -i 0.5 -K -R             0      260      298     2564
 3143 rtkit    /usr/lib/rtkit/rtkit-daemon        0      300      324     2548
 1588 root     cron                               0      292      326     2344
 1589 avahi    avahi-daemon: chroot helpe         0      124      332     1632
 1523 root     /usr/sbin/irqbalance               0      316      340     2096
  585 root     upstart-socket-bridge --dae        0      328      349     1820
 3033 tecmint  /usr/bin/dbus-launch --exit        0      328      359     2160
 1346 root     upstart-file-bridge --daemo        0      348      370     1776
 2607 root     /usr/bin/xdm                       0      188      375     2368
 1635 kernoops /usr/sbin/kerneloops               0      352      384     2684
  344 root     upstart-udev-bridge --daemo        0      400      426     2132
.....
-------------------------------------------------------------------------------
  134 11                                          0  2171428  2376266  3587972
Further more, there are options for graphical reports that you can also use and we shall dive into them in this sub section.
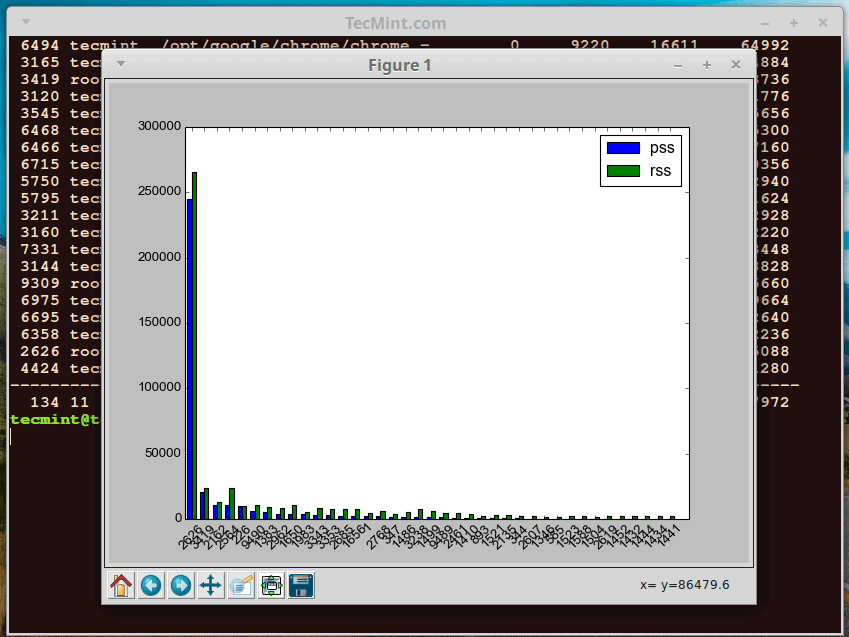
You can produce a bar graph of processes and their PSS and RSS values, in the example below, we produce a bar graph of processes owned by the root user.
The vertical plane shows the PSS and RSS measure of processes and the horizontal plane represents each root user process:
$ sudo smem --userfilter="root" --bar pid -c"pss rss"
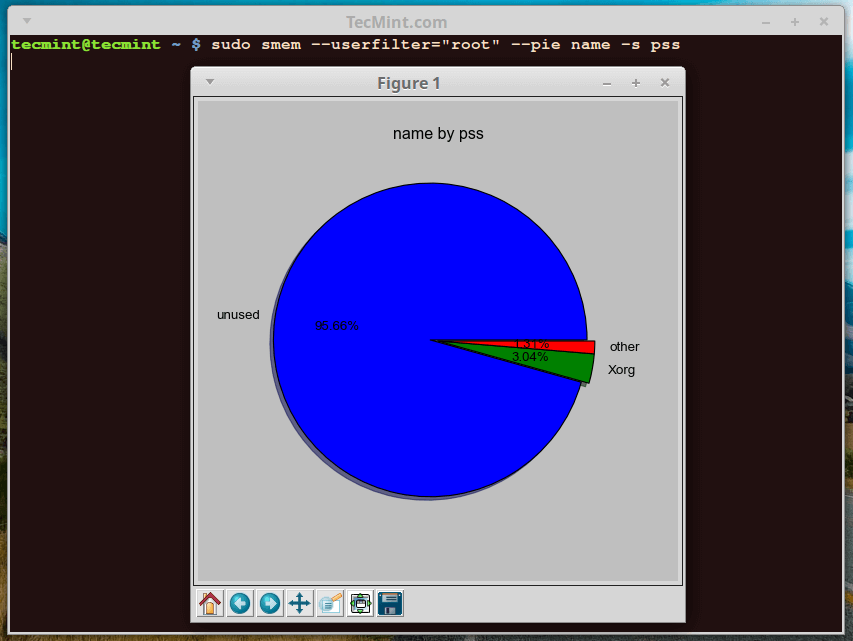
You can also produce a pie chart showing processes and their memory consumption based on PSS or RSS values. The command below outputs a pie chart for processes owned by root user measuring values.
The --pie name means label by name and -s option helps to sort by PSS value.
$ sudo smem --userfilter="root" --pie name -s pss
There are many other known fields apart from PSS and RSS used for labeling charts:
To get help, simply type, smem -h or visit the manual entry page.
We shall stop here with smem, but to understand it better, use it with many other options that you can find in the man page. As usual you can use the comment section below to express any thoughts or concerns.
Reference Links: https://www.selenic.com/smem/



Why I am getting more than 100%?
$ smem -tur -p User Count Swap USS PSS RSS oracle 142 2.67% 13.33% 25.63% 204.15% --------------------------------------------------- 142 2.67% 13.33% 25.63% 204.15%what is rss and pss ? please elaborate if there is more such Abbrv,
@John
RSS(Resident Set Size) is the amount of memory occupied by a process that is held in main memory (RAM) and PSS(Proportional Set Size) is the amount RAM occupied by a process(which is the private memory of that process plus the proportion of shared memory with one or more other processes).
Hi,
I’m using CentOS release 6.7. I have installed and enabled EPEL repo, But getting the following
Loaded plugins: fastestmirror, security
Setting up Install Process
Loading mirror speeds from cached hostfile
epel/metalink | 12 kB 00:00
* base: mirror.keystealth.org
* epel: s3-mirror-us-west-2.fedoraproject.org
* extras: mirror.keystealth.org
* updates: mirror.keystealth.org
epel | 4.3 kB 00:00
epel/primary_db | 5.8 MB 00:00
No package python-tk available.
Error: Nothing to do
@Ravi,
I think there’s difference in package names, the old CentOS 6.7 uses tkinter package, so install it using yum as shown:
Thanks Ravi. Its working fine now.
Okay, found it. On Centos it’s sudo yum install tkinter.
@Steve,
On which CentOS version you haven’t found python-tk package, on my CentOS 7 I just did
yum install python-tkand it installed successfully.It’s Oracle Linux 7.2 which is basically CentOS. Weird.
Have you tried installing tkinter package, which is same as python-tk, give it a try and let me know..
What is this python-tk package you’re talking about? Can’t find it. Are you talking about tkinter?