There are plenty of tools to monitor MySQL performance and troubleshoot a server, but they don’t always perfect match for a MySQL developer or administrator’s for their common needs, or may not work in some situations, such as remote or over the web monitoring.

Luckily, there are variety of open source tools created by MySQL community to fill the gaps. On the other hand, it’s very difficult to locate these tools via web searches, that’s the reason we’ve compiled 4 command line tools to monitor MySQL database uptime, load and performance in Linux.
Uptime means how long the database has been running and up since its last shutdown or restart. Getting information about uptime is very crucial in many situations, as it helps system administrators to check the status of MySQL database about, how many queries per second that MySQL database serves, threads, slow queries and lots of interesting statistics.
1. Mytop
Mytop is one of my classic open source and free console-based (non-gui) monitoring tool for MySQL database was written by Jereme Zawodny using Perl language. Mytop runs in a terminal and displays statistics about threads, queries, slow queries, uptime, load, etc. in tabular format, much similar to the Linux top program. Which indirectly helps the administrators to optimize and improve performance of MySQl to handle large requests and decrease server load.
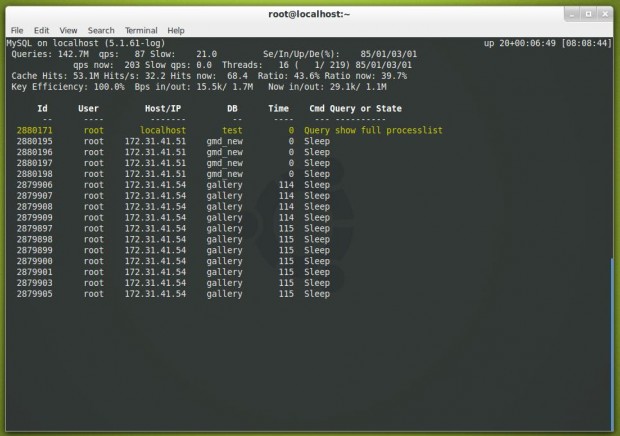
There are mytop packages available for various Linux distributions, such as Ubuntu, Fedora and CentOS. For more about installation instruction read: How to Install Mytop (MySQL Monitoring) in Linux
2. Mtop
mtop (MySQL top) is a another similar open source, command line based real time MYSQL Server monitoring tool, was written in Perl language that display results in tabular format much like mytop. mtop monitors MySQL queries which are taking the most amount of time to finish and kills those long running queries after certain specified time.
In addition, it also enable us to identify performance related problems, configuration information, performance statistics and tuning related tips from the command line interface. The two tools are very similar, but mtop is not actively maintained and may not work on newly installed MySQL versions.
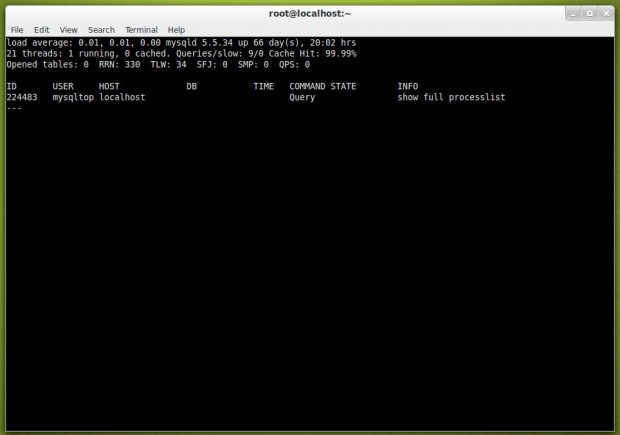
For more about installation instruction read: How to Install Mtop (MySQL Monitoring) in Linux
3. Innotop
Innotop is a real time advanced command line based investigation program to monitor local and remote MySQL servers running under InnoDB engine. Innotop includes many features and comes with different types of modes/options, which helps us to monitor various aspects of MySQL performance to find out what’s wrong going with MySQL server.
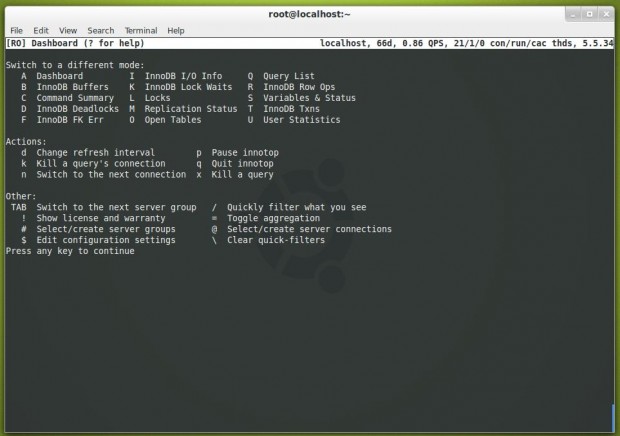
For more about installation instruction read: How to Install Innotop (MySQL Monitoring) in Linux
4. mysqladmin
mysqladmin is a default command line MySQL client that comes pre-installed with MySQL package for performing administrative operations such as monitoring processes, checking server configuration, reloading privileges, current status, setting root password, changing root password, create/drop databases, and much more.
To check the mysql status as well as uptime run the following command from the terminal, and make sure you must have root permission to execute the command from the shell.
[root@localhost ~]# mysqladmin -u root -p version
Enter password:
Sample Output
mysqladmin  Ver 8.42 Distrib 5.1.61, for redhat-linux-gnu on i386
Copyright (c) 2000, 2011, Oracle and/or its affiliates. All rights reserved.

Oracle is a registered trademark of Oracle Corporation and/or its
affiliates. Other names may be trademarks of their respective
owners.

Server version		5.1.61-log
Protocol version	10
Connection		Localhost via UNIX socket
UNIX socket		/var/lib/mysql/mysql.sock
Uptime:			20 days 54 min 30 sec

Threads: 1  Questions: 149941143  Slow queries: 21  Opens: 752  Flush tables: 1  Open tables: 745  Queries per second avg: 86.607
For more about mysqladmin commands and examples, read: 20 mysqladmin Commands for MySQL Administration in Linux
Conclusion
If you’re looking for a good monitor tool for your own work, I recommend mytop and innotop. I used to depend on mytop for my daily monitoring purposes, but now I shifted to innotop, because it displays much more statistics and information, including important transactions.



Hi Ravi,
I just wanted to say thanks for this informative article!
I personally tend to like GUI-based apps over command-line utilities. For those of you who are like me, you might want to try a monitoring tool for Linux called Navicat Monitor. It uses an agentless architecture to collect all kinds of process metrics over SSH/SNMP.
I have found it to be indispensable for tuning my own MySQL servers.
Thanks!
David
There is a lot that can be added to the article. Also, I would love to see articles that provide an in-depth view of MySQL performance monitoring using tools such as MEM, PMM, Monyog, etc.
Look forward to it.
@RK199,
Thanks for informing us about these MySQL monitoring tools, I will definitely mention those in the article.
Innotop could be a great tool but is dangerously insecure. It requires that the password either be entered on the command line (and retrievable via .bash_history) or stored in plain text in a config file. The dev of the tool feels prompting for the password in the same manner that mysql’s CLI does would be “hard/impossible/impractical” (his words). Push requests with a fix have been made by a few people but have been ignored. If he’s skimping on the most basic of security features, I cringe to think of what else has been avoided because “it’s hard”.
This is not a tool that should be used in a production environment.
Could you not use gpg to secure the password? I’m not familiar with the tool so don’t know if it’s possible.
A simple space at the beginning of the command will stop it from being entered in .bash_history
You are talking about very specific tools, but have you tried usual things like Pingdom or Anturis, or Cacti or anything like that. I think it is much better to set up such a tool and than monitor the whole system with one tool.